Technical Analysis 101: Inverse Head and Shoulders Pattern Explained
Have you ever stared at a forex chart and thought you spotted a perfect reversal, only to have the market whip back in the opposite direction? You’re not alone. Many traders struggle to recognize chart patterns in real time, especially when emotions and volatility cloud their judgment.
Among the most reliable reversal signals is the inverse head and shoulders pattern — a technical analysis pattern and a classic bullish reversal pattern used to identify potential shifts from a downtrend to an uptrend. Traders often misread the formation, enter too early, or exit too late, turning what should be a high-probability setup into a frustrating loss.
The good news? Once you truly understand the mechanics, psychology, and trading tactics behind this pattern, it can become one of your most valuable tools for spotting trend reversals. In this guide, we’ll break down everything you need to know about the inverse head and shoulders, from its structure to practical trading strategies you can apply right away.
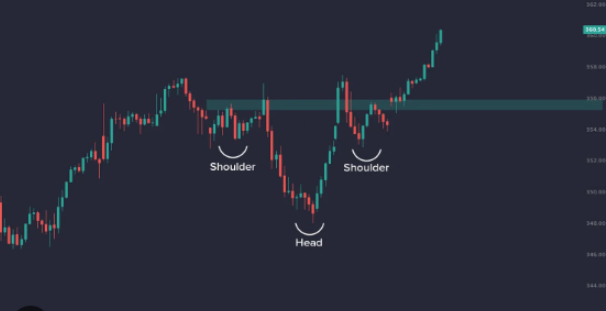
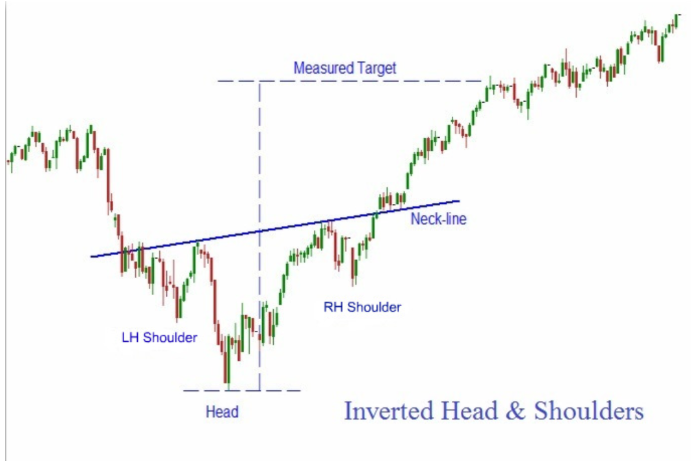
The structure of the inverse head and shoulders is straightforward: the pattern consists of three main components—the left shoulder, the head, and the right shoulder—along with a neckline that acts as a key breakout level.
Introduction to the Head and Shoulders Chart Pattern
The head and shoulders family of chart patterns is one of the oldest and most widely recognized formations in technical analysis. At its core, it represents a tug-of-war between buyers and sellers, with one side gradually losing momentum and the other preparing to seize control. The standard head and shoulders pattern is typically bearish: it forms after an uptrend, signaling that buying pressure has run its course and a downtrend is likely to follow. Its mirror image, the inverse head and shoulders, is bullish, often emerging after a prolonged decline and suggesting that sellers are running out of steam. In technical analysis, the inverse head and shoulders is considered a shoulders pattern bullish, indicating a potential reversal from a bearish to a bullish trend.
Classic vs. Inverse: Understanding the Difference
The classic head and shoulders consists of three peaks: a left shoulder, a higher head, and a right shoulder that usually matches or comes close to the left in height. The shoulders pattern begins with the formation of the left shoulder, marking the initial stage of the reversal pattern. A “neckline” connects the lows between these peaks, and once price breaks below that neckline, traders view it as confirmation of a downtrend.
The inverse version flips this structure. Instead of peaks, you see troughs: the market makes a low (left shoulder), plunges to a deeper low (head), and then rises, only to dip again into a shallower low (right shoulder). This process highlights the shoulders formation, as the left and right shoulders flank the central head and are key to identifying the pattern. When price breaks above the neckline — drawn across the highs between the shoulders and the head — it signals a potential trend reversal upward. The difference is subtle on paper, but in practice it can completely shift the way traders position themselves.

Why This Pattern Matters in Technical Analysis
What makes the head and shoulders so important isn’t just its recognizable shape. It’s the psychology beneath it. In the case of the inverse head and shoulders, sellers attempt to push the market lower several times but fail to maintain control. Buyers, noticing this repeated failure, begin to step in with more confidence. The neckline breakout often acts as the “tipping point” where momentum decisively shifts, making the inverse head and shoulders a classic trend reversal pattern in technical analysis
For traders, this provides a structured framework to plan entries, exits, and risk management, and helps them anticipate market movements more effectively. Unlike some vague chart patterns that rely heavily on subjective interpretation, the head and shoulders gives clear reference points: shoulders, head, neckline, and breakout confirmation.
Historical Reliability and Market Context
Over decades of market research, the inverse head and shoulders has proven to be a reliable reversal pattern, especially in liquid markets like forex, equities, and commodities. The shoulders pattern formed in this setup is a key signal for reversals after a prior downtrend. While no pattern is foolproof, studies show that when combined with volume analysis, successful retests of support, and technical indicators like the Stochastic Oscillator, the pattern’s reliability and success rate improve significantly. It’s also versatile: whether you’re trading EUR/USD on a 15-minute chart or analyzing the S&P 500 on a weekly chart, the same dynamics apply. That’s what makes this pattern a cornerstone of technical analysis. For traders willing to study its structure and nuances, the inverse head and shoulders can transform uncertainty into clarity — and clarity into confidence.
Formation of the Inverse Head
The beauty of the inverse head and shoulders pattern lies in its structure. , with the pattern formed being recognized by its distinct arrangement of price movements. Once you know what to look for, you can begin spotting it across multiple markets and timeframes. The shoulders pattern involves specific stages and components: the left shoulder, head, right shoulder, and neckline, each playing a crucial role in the setup. Still, the formation is not always picture-perfect, and many traders miss the nuances that separate a true setup from market noise. Let’s walk step by step through how the inverse head and shoulders develops and what each stage tells us about market sentiment.
Step 1: The Left Shoulder
The pattern often begins in the midst of a downtrend, when selling pressure has been dominant. Price falls to a low point before bouncing back as buyers test the waters. rAt this point, the left shoulder forms as the first trough in the inverse head and shoulders pattern, typically marked by a decline followed by a bounce. This bounce forms the left shoulder. The left shoulder formation is significant because it marks the initial signal of a potential trend reversal and helps traders identify the start of the pattern’s development. At this stage, traders see nothing unusual. To most, it looks like just another pullback within a larger bearish trend.
Step 2: The Head
The next downswing takes price below the left shoulder’s low, often dramatically, as price declines intensify during this initial phase. This deeper dip forms the head of the pattern, resulting from significant price drops that push the market to new lows. Sellers are still in control here, pressing the market down to new lows. However, the aggressive drop often flushes out the last of the weaker buyers, creating capitulation. When price rebounds sharply from this deeper low, it signals that selling momentum is not as sustainable as it once appeared. The head is usually the most obvious part of the formation, as it visually stands out from the shoulders.
Step 3: The Right Shoulder
After the rebound from the head, price pulls back once more, forming the right shoulder. This right shoulder formation is the final stage in the inverse head and shoulders pattern, signaling a potential trend reversal. Importantly, this decline stops short of the head’s low, instead bottoming at or near the level of the left shoulder. The presence of two shoulders—both the left and right—confirms the pattern’s structure and increases its reliability for traders. This is where attentive traders begin to take notice: the inability of sellers to push the market to new lows is the first visible sign of weakness in the downtrend. The right shoulder is also where buying pressure begins to quietly accumulate, setting the stage for a breakout.
Step 4: The Neckline
Draw a trendline across the two swing highs between the shoulders and the head. This line is called the neckline. , and it acts as a trend line on the price chart that connects key resistance points. It represents the key resistance level that buyers must overcome to complete the pattern. The neckline may be horizontal, sloping upward, or occasionally downward, depending on price action. An upward-sloping neckline is generally seen as stronger, reflecting growing bullish pressure even before the breakout occurs.
Confirming the Breakout
The pattern is not confirmed until price closes decisively above the neckline. Breakout signals are often observed when the initial breakout above the neckline occurs, but traders should be cautious and look for confirmation. Conservative traders wait for a clear candle close beyond the neckline, while aggressive traders may anticipate the move once momentum builds. When the price broke above the neckline, it confirms the pattern and signals a potential trend reversal. Volume plays a crucial role here: ideally, the breakout should be accompanied by a noticeable surge in trading activity. Rising volume confirms that institutional players and serious buyers are stepping in to fuel the reversal.
Volume Dynamics During Formation
Volume analysis often distinguishes valid patterns from false ones. During the shoulder formation, volume typically decreases through the left shoulder and head, reflecting fading selling interest. It is important to observe the volume dynamics during the left and right shoulders, as higher volume in these areas helps confirm the validity of the pattern and signals a potential trend reversal. As the right shoulder forms and price rallies toward the neckline, volume often picks up, showing buyers gaining conviction. Finally, the breakout above the neckline is ideally confirmed by a significant volume spike — a hallmark of a high-quality pattern.

Psychology of the Head and Shoulders Pattern
Technical analysis often emphasizes price levels, chart shapes, and breakout points, but underneath every pattern lies market psychology. The inverse head and shoulders is essentially a visual story of shifting control between sellers and buyers. Understanding this psychology not only makes the pattern easier to spot but also gives you greater confidence when deciding how to trade it, helping you make more informed trading decisions.
The Left Shoulder: First Signs of Buyer Interest
At the start of the formation, the downward trend appears intact. Sellers drive the market lower until buyers step in with a small rally. For most participants, this looks like nothing more than a routine pullback. However, the first shoulder shows that buyers are willing to oppose the downward trend, even if only briefly. It’s the first crack in the armor of bearish dominance.
The Head: Capitulation and Exhaustion
The next leg down — the head — represents the market’s attempt to push to fresh lows. Sellers regain control, driving price to its lowest point in the pattern. This phase is marked by significant price movement, as the aggressive drop and subsequent rebound help confirm the pattern’s reliability. Many traders panic here, assuming the downtrend has plenty of fuel left. Stop-losses are triggered, weak hands are flushed out, and pessimism peaks. Yet this aggressive move often carries the seeds of its own failure. When price rebounds strongly from the head, it reveals exhaustion: sellers are no longer able to sustain heavy pressure, while buyers sense an opportunity to accumulate at bargain levels.
The Right Shoulder: Testing Bearish Resolve
The right shoulder is arguably the most telling part of the formation. Sellers attempt one last push lower but fail to match the depth of the head. This inability to create a new low speaks volumes about market sentiment. When the price reaches the level of the left shoulder, it becomes a significant moment for traders, as it can signal a potential confirmation of a trend reversal or a key resistance test. Buyers grow more confident, interpreting the failed test as proof that the worst may be over. Meanwhile, some sellers begin to cover short positions, fueling small rallies. In effect, the right shoulder is the psychological battleground where bearish conviction starts to crumble.
The Neckline Break: Shifting Momentum
The neckline represents resistance — not just technically, but emotionally. Traders who bought too early during the left shoulder or head often use the neckline area to exit at breakeven, adding to selling pressure. But when buyers manage to push through this barrier with conviction, the psychology flips. What was once resistance now becomes support, and sidelined traders rush in to participate. The breakout isn’t just about crossing a line on a chart; it reflects a genuine shift in market belief that the downtrend is over and an uptrend is beginning, often signaling an expected upward movement in price as traders set profit targets and manage risk.
Institutional vs. Retail Mindsets
Retail traders often get caught in the emotional swings of this pattern — selling in panic at the head or hesitating to buy the breakout. Institutional traders, however, tend to view the inverse head and shoulders as an accumulation opportunity. They recognize the exhaustion of sellers and strategically build positions during the formation, adding aggressively on the breakout.Market volatility also plays a significant role in shaping these trading decisions and can affect the reliability of the pattern, as higher volatility may signal increased uncertainty or confirm breakout signals. This divergence in mindset is part of what makes the pattern so powerful: when institutions lean bullish, volume surges and the breakout has real staying power.

Trading the Head and Shoulders Patterns
Identifying an inverse head and shoulders pattern is one thing. Turning that recognition into a profitable trade is another. Many traders spot the formation but struggle with execution: entering too early, placing stops too close, or exiting before the move reaches its potential. When trading inverse head patterns, proper execution is crucial to capitalize on the setup and manage risk effectively. To trade this pattern effectively, you need to balance structure, discipline, and risk management.
General Trading Rules for Pattern-Based Strategies
At its core, the head and shoulders family of patterns — both classic and inverse — provides a framework for reversal trading. Shoulders pattern trading offers a structured approach to reversal strategies, helping traders identify, confirm, and execute trades based on these setups. That means you’re looking for the end of a trend and the beginning of a new one. Unlike continuation patterns, these setups don’t guarantee quick follow-through. Instead, they often require patience.
Some general rules apply across the board:
- Wait for confirmation — Don’t assume a pattern is valid until price breaks the neckline. Premature entries can leave you stuck in a false setup.
- Use volume as a filter — Volume should contract during the formation and expand on the breakout. Weak or flat volume on the breakout may signal that conviction is lacking.
- Don’t ignore context — A head and shoulders that forms in the middle of a choppy range is less reliable than one that forms after a sustained trend.
Comparing Head and Shoulders vs. Inverse Setups

While the mechanics are nearly identical, the standard and inverse patterns occur in different market contexts. The classic head and shoulders appears at market tops, warning that buying enthusiasm is waning. Traders use it to position for short entries or to protect profits in long trades.
The inverse head and shoulders, in contrast, forms at market bottoms. It signals that selling pressure is diminishing and that buyers may be preparing to regain control. Forex traders, for example, often use the inverse formation to anticipate a bullish trend reversal after a currency pair has been in decline for weeks or months.
The reliability of each setup depends heavily on the surrounding market structure. A head and shoulders top appearing after a steep rally carries far more weight than one forming in sideways chop. Likewise, an inverse pattern following a prolonged downtrend is much more convincing than one that forms after just a few hours of selling on an intraday chart. Intraday charts, such as the 1-minute, 5-minute, or 15-minute timeframes, are commonly used by day traders to identify these patterns for shorter-term trades, but patterns on higher timeframes are generally considered more reliable.
Risk/Reward Considerations Unique to This Pattern

Trading any reversal pattern involves a degree of risk. Because the market is in the process of shifting direction, false breakouts are common. That’s why risk/reward management is critical. After a confirmed breakout above the neckline, traders often initiate long positions to capitalize on the potential trend reversal.
- Stop Placement — A logical place for stops in the inverse pattern is just below the right shoulder or, more conservatively, beneath the head. The right-shoulder stop offers a better risk/reward ratio but is more vulnerable to getting triggered by volatility. The head stop is safer but increases the risk size.
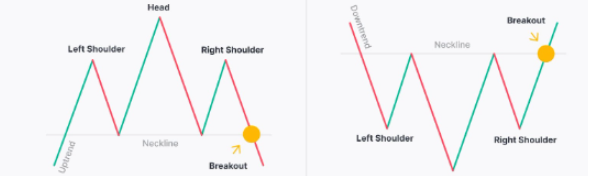
- Price Targets — A standard technique is to measure the distance from the head to the neckline and project that upward from the breakout point. For example, if the head sits 200 pips below the neckline, the projected move after breakout is 200 pips higher. While not perfect, this method gives a consistent target framework.
- Scaling Out — Many experienced traders scale out of positions rather than closing the trade all at once. For instance, they may take partial profits at the measured target while leaving a runner position open in case momentum extends further.
- Multiple Timeframes — An inverse head and shoulders on a higher timeframe (daily or weekly) tends to produce larger and more reliable moves than one on a 5-minute chart. Aligning multiple timeframes can dramatically improve the odds of success.
Example Application
Imagine EUR/USD has been trending lower for several months. On the daily chart, you spot a clear inverse head and shoulders forming, with the neckline near 1.0800. As the pair rallies through the neckline on strong volume, you enter long at 1.0820. You place your stop below the right shoulder at 1.0700, risking 120 pips. The measured move projects a target at 1.1000, giving you a potential 180-pip gain. After the breakout, you observe the price rising, confirming the anticipated trend reversal. That’s a 1.5:1 reward-to-risk ratio — solid for a pattern-based trade.
This structured approach allows you to trade with confidence, knowing that your plan is based on proven technical logic rather than guesswork.

Inverse Head and Shoulders in Different Markets
Stocks: Classic Reversals and Volume Clues
In the stock market, the inverse head and shoulders pattern stands out as a classic reversal pattern, often signaling a shift from bearish sentiment to a bullish trend. When this shoulders pattern occurs after a prolonged decline, it can alert traders to a potential trend reversal and a new buying opportunity. One of the most important clues in stocks is volume: a true reversal pattern is typically confirmed when the price breaks above the neckline on a surge in trading volume. This increase in volume suggests that institutional buyers are stepping in, adding weight to the bullish signal. For example, if a stock forms an inverse head and shoulders and the price breaks out above the neckline with a noticeable volume spike, it’s a strong indication that a trend reversal is underway. By watching for these volume cues, traders can filter out false signals and focus on high-probability setups in the stock market.
Forex: Volatility and Pattern Reliability
The forex market is known for its rapid price movements and frequent swings, which can make trading the head and shoulders pattern both challenging and rewarding. The inverse head and shoulders pattern remains a valuable tool for spotting trend reversals, but its reliability increases when combined with other technical indicators. Due to the high volatility in forex, traders often seek additional confirmation before entering a long position. For instance, a bullish MACD crossover or a decisive move above a key resistance line can strengthen the case for a bullish trend reversal. If a currency pair like EUR/USD forms an inverse head and shoulders and the price breaks above the neckline while the MACD turns bullish, it’s a compelling signal that an upward trend may be starting. By using the shoulders pattern alongside other technical indicators, forex traders can improve their odds of catching significant trend reversals.
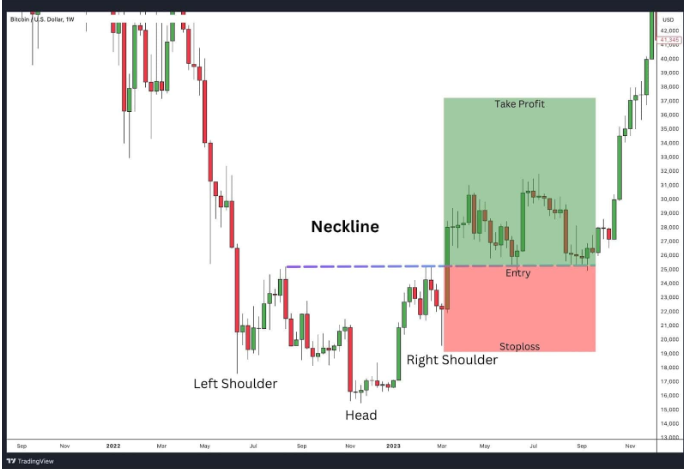
Cryptocurrency: Pattern Adaptation in High-Volatility Assets
Cryptocurrency markets are notorious for their extreme volatility, which means that chart patterns like the inverse head and shoulders require careful adaptation. While the pattern can still signal potential trend reversals, traders need to account for the rapid and sometimes unpredictable price movements common in crypto. One effective approach is to use tighter stop-losses and more conservative profit targets, helping to manage risk in these fast-moving markets. For example, if Bitcoin forms an inverse head and shoulders and price breaks above the neckline, a trader might set a stop-loss just below the right shoulder and a profit target based on the height of the pattern. This strategy allows for quick reaction to sudden reversals while still capitalizing on the bullish momentum that the head and shoulders pattern signals. By tailoring their approach, crypto traders can use this classic reversal pattern to navigate the unique challenges of digital assets.
Commodities: Cyclical Trends and Pattern Interpretation
In commodity markets, the inverse head and shoulders pattern can be a powerful indicator of a trend reversal, but it’s essential to consider the broader context of cyclical trends and seasonal factors. Commodities like gold, oil, or agricultural products often experience price swings tied to supply and demand cycles, geopolitical events, or weather patterns. When the head and shoulders pattern forms during a period of strong demand or heightened market tension, its reliability as a reversal pattern increases. For instance, if gold forms an inverse head and shoulders during a time of rising geopolitical risk, a breakout above the neckline could signal a significant bullish move. On the other hand, if the pattern appears during a seasonally weak period, traders should be more cautious. By combining the inverse head and shoulders with an understanding of market cycles and other forms of analysis, commodity traders can make more informed decisions and better anticipate potential trend reversals.
Avoiding False Signals and False Breakouts

No matter how well you analyze the market, not every inverse head and shoulders will deliver a clean reversal. In fact, false signals are one of the biggest frustrations for traders. These occur when the market teases you with what looks like a textbook setup, only to fizzle out or reverse after the breakout. To avoid these traps, it’s crucial to wait until the pattern completes before making trading decisions. By learning to filter weak patterns and manage your entries carefully, you can reduce the sting of these traps.
Common Traps in Inverse Head and Shoulders Setups
- Shallow Right Shoulders — If the right shoulder is too shallow compared to the left, the pattern may lack balance. The shoulders pattern involves specific structural criteria that must be met to avoid traps; uneven formations often reflect indecision rather than a true shift in market control.
- Weak Necklines — A neckline drawn across sloppy highs with no clear level of resistance can be unreliable. If the neckline itself isn’t respected by price action, the breakout loses significance.
- Premature Entries — Many traders jump in before price actually closes above the neckline. While aggressive entries can work in strong markets, they expose you to more failed setups.
- False Volume Clues — Some breakouts occur on light volume, which signals that large market players aren’t participating. These moves are more likely to fade.
How to Filter False Signals
- Volume as Confirmation — Ideally, volume should contract during the head formation and then expand strongly on the breakout. A lack of volume follow-through is often a red flag.
- Trend Context — The best inverse head and shoulders patterns occur after extended downtrends. If the pattern forms in the middle of a sideways market, treat it with caution.
- Timeframe Alignment — A bullish breakout on the hourly chart that aligns with bullish momentum on the daily chart is more reliable. If higher timeframes disagree, the pattern may fail.
Confluence with Other Indicators — Look for agreement with moving averages, Fibonacci retracements, or momentum indicators like RSI. Using additional technical indicators can further improve confirmation and help filter out false signals. When multiple tools point in the same direction, the odds of success improve.

Case Examples of Failed Patterns
Consider a trader who spots an inverse head and shoulders on GBP/JPY after a short decline. The right shoulder forms, and price briefly breaks above the neckline — but on very light volume. Within hours, the market collapses back below the neckline and continues downward. This is a textbook case of a false breakout: the setup looked good, but without strong participation, it couldn’t sustain itself.
Another common example is when traders jump in before the neckline is broken. Suppose AUD/USD appears to be forming the pattern. Eager traders buy early, expecting the breakout. But instead, the right shoulder extends lower, invalidating the setup and triggering stops. The premature entry turned what could have been a valid pattern into an expensive mistake.
Bottom Line
False signals are part of trading, but they don’t have to wreck your strategy. By filtering setups with volume, context, and confluence, you’ll avoid many of the traps that snare inexperienced traders. More importantly, you’ll gain the confidence to hold your trades when a genuine breakout occurs — because you’ll know the difference between noise and real opportunity, and be better positioned to capture bullish reversals when they arise.

Head and Shoulder Entry and Exit Points
Recognizing the inverse head and shoulders is only half the battle. To trade it profitably, you need precise strategies for when to enter—identifying the optimal entry point is crucial— where to place stops, and how to exit. Poor execution can turn even the most reliable pattern into a losing trade. Let’s break down practical entry and exit approaches that give you the best balance of safety and reward.
Best Entry Strategies
- Neckline Breakout Entry
The most straightforward approach is to buy once price closes decisively above the neckline. This confirms the pattern and reduces the risk of a false setup. Many traders wait for a candle to close beyond the neckline, not just a brief spike, to avoid getting caught in a fake-out. - Retest Entry
A more conservative method is to wait for price to break the neckline and then retest it as support. If the neckline holds and price bounces, that’s your cue to enter. While this approach may miss some trades if price doesn’t pull back, it offers strong confirmation and a tighter stop placement. - Aggressive Right Shoulder Entry
Advanced traders sometimes anticipate the breakout by entering near the bottom of the right shoulder. This allows for a smaller stop-loss and larger potential profit. The trade-off is higher risk: if the neckline never breaks, the pattern fails, and the trade is invalid.
Exit Strategies
- Measured Move Target
The classic method is to measure the vertical distance between the head and the neckline, then project that distance upward from the breakout point. For instance, if the head is 100 pips below the neckline, your target is 100 pips above the neckline. This provides a clear, objective exit point. - Scaling Out
Many traders prefer to scale out in stages. For example, close half the position at the measured target, then trail the stop on the remaining position to capture any extended trend. This hybrid approach locks in profits while keeping you in the game if momentum continues. - Trailing Stops
Another popular method is to use a trailing stop, either manually or with an automated system. As price moves in your favor, you raise the stop to protect gains. This works especially well in forex, where strong breakouts can run for hundreds of pips.
Keeping part of your position open with a trailing stop allows you to benefit from sustained upward momentum that often follows a confirmed breakout.
Example in Action
Suppose USD/JPY has been trending lower for weeks, forming an inverse head and shoulders with a neckline at 145.50. The head dips to 143.00, creating a 250-pip distance. When price breaks above the neckline at 145.70, you enter long. , as this breakout confirms a bullish reversal signaled by the pattern. The measured move projects a target at 148.20. You set your stop just below the right shoulder at 144.50, risking 120 pips for a potential 250-pip reward — more than a 2:1 ratio.
If price rallies strongly, you might close half the position at 148.20 and let the rest ride with a trailing stop. This way, you secure profits while staying open to further upside if momentum persists.
Key Takeaway
Your choice of entry and exit strategy depends on your risk tolerance, style, and timeframe. Whether you’re aggressive or conservative, the inverse head and shoulders provides clear levels to guide your decisions. Combine disciplined entries with structured exits, and this shoulder pattern can become a cornerstone of your trading playbook.