What Is a Descending Triangle? Pattern Features, Bearish Signals, and How to Trade
In the dynamic world of financial markets, recognizing a descending triangle is a crucial skill for any trader looking to identify a potential market downturn. While this powerful pattern can signal a high-probability bearish breakout, understanding its formation requires a solid foundation in a more fundamental concept: chart patterns. Chart patterns are the visual language of the market, revealing the psychology of buyers and sellers through recurring shapes and formations. A descending triangle is one of the most reliable and telling of these patterns, serving as a powerful forecast of a potential downturn. This guide will walk you through everything you need to know about this specific formation.
Chart Patterns
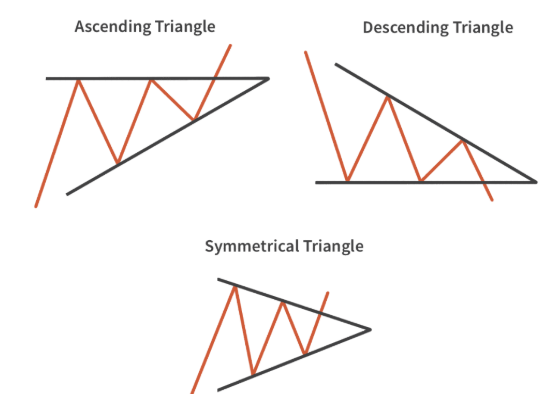
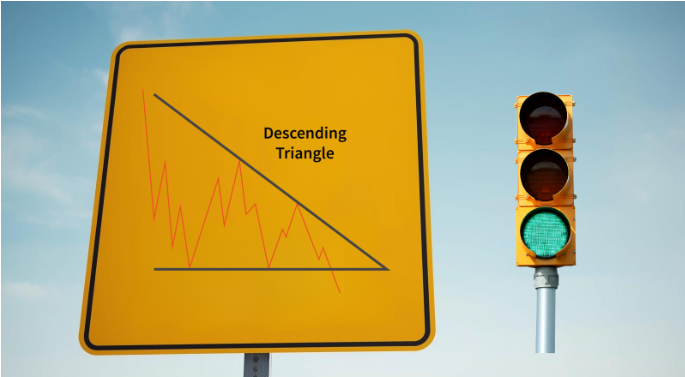
Chart patterns are essentially a form of technical analysis that helps traders predict where a currency pair, stock, or commodity might move next. They are a universal tool, transcending different asset classes and timeframes, from a 5-minute scalping chart to a monthly long-term investment chart. At their core, these patterns reveal the underlying psychology of the market. They show periods of consolidation, indecision, or a clear shift in momentum. A consolidation phase often precedes a breakout and is visually represented by a triangle formation, where price action narrows within converging trend lines. Think of them as traffic signs on the financial highway: a well-formed pattern can signal a potential breakout, a reversal of the current trend, or a continuation of the existing one. For instance, a continuation pattern suggests that the prevailing trend is likely to continue after a brief pause, whereas a reversal pattern signals that the trend is about to change direction. Understanding these patterns allows traders to identify opportunities, manage risk, and make more informed decisions.
The beauty of chart patterns lies in their simplicity and historical reliability. They are not random formations; rather, they are the visual manifestation of market forces at play. A pattern forms as traders react to the same levels of support and resistance, creating predictable shapes on the chart. Trend lines and horizontal trendlines are used to identify these formations, with drawing trend lines being essential for recognizing triangle patterns and other key setups. By identifying these formations, a trader can anticipate potential entry and exit points, set a clear stop-loss, and determine a realistic profit target. The art lies not just in recognizing the shape, but in understanding the context in which it appears. A pattern forming during a period of high volume or after a major news event carries more weight than one that forms in a quiet, sideways market. While no pattern is foolproof, integrating them into a comprehensive trading plan significantly enhances a trader’s ability to navigate the complexities of the market.
There are three main categories of chart patterns: continuation, reversal, and bilateral. The descending triangle falls into the continuation category, but its bearish signal can also act as a reversal if it forms at the top of an uptrend. Other common continuation patterns include flags and pennants, which represent a short-term pause in a strong trend before it resumes. Triangle formations are defined by the interaction of trend lines and horizontal trendlines, which help traders anticipate breakouts. Reversal patterns, such as the head and shoulders or double top/bottom, indicate a trend is about to reverse its direction. Bilateral patterns, like the symmetrical triangle, suggest a breakout is imminent but do not specify the direction, requiring traders to wait for a confirmed break. This wide array of patterns provides a visual roadmap for traders, helping them make sense of market noise and focus on high-probability setups. Each pattern tells a unique story about the balance of power between buyers and sellers, and learning to read that story is a vital step in becoming a proficient trader.
Introduction to Chart Patterns
Chart patterns are a cornerstone of technical analysis, offering traders a visual roadmap to anticipate future price movements in financial markets. By studying the way prices move and form recognizable shapes over time, traders can gain valuable insights into market sentiment and potential trading opportunities. These patterns are not random; they reflect the collective psychology of buyers and sellers, revealing moments of indecision, consolidation, or momentum shifts. Among the many chart patterns used in technical analysis, some signal that a trend is likely to continue, while others suggest a reversal or a possible breakout in either direction. The descending triangle pattern is one of the most popular and reliable chart patterns, especially for identifying potential bearish trends. By mastering continuation patterns like the descending triangle, traders can enhance their ability to make informed decisions and manage risk effectively.
Types of Chart Patterns
Chart patterns come in several distinct types, each providing unique clues about the likely direction of price movement. The three main categories are:
- Continuation patterns: These patterns, such as the descending triangle pattern, indicate that the current trend is likely to persist after a brief pause. When a continuation pattern forms, it suggests that the market is consolidating before resuming its previous direction.
- Reversal patterns: These patterns, like the head-and-shoulders or double top, signal that the existing trend may be coming to an end and a new trend in the opposite direction could begin.
- Bilateral patterns: These patterns, including symmetrical triangles, can result in a breakout in either direction. Traders must wait for confirmation of the breakout direction before taking action.
Understanding the differences between these chart patterns helps traders anticipate whether the market is likely to continue its current path or change course, allowing for more strategic entries and exits.
Understanding Descending Triangle Patterns
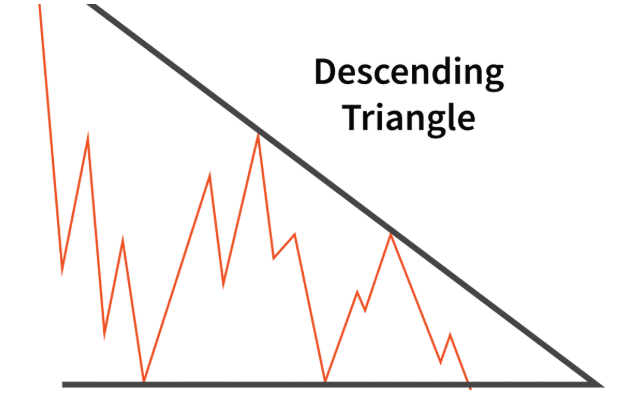
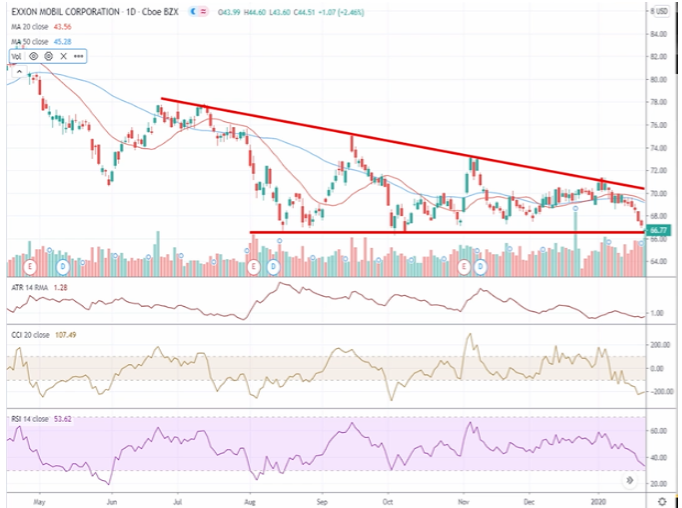
The descending triangle is a classic continuation pattern that signals the likely continuation of a bearish trend. It is one of the most reliable and easy-to-identify chart patterns, making it a favorite among technical analysts. This pattern is formed by two key trendlines: a horizontal support line and a descending resistance line. The horizontal support line, often referred to as the lower trend line support or horizontal support level, is a level where the price repeatedly finds a floor, unable to fall further, indicating a strong group of buyers at that price. The descending resistance line, also known as a downward sloping trendline or descending trendline, is a series of lower highs, showing that sellers are increasingly willing to sell at lower prices. This trendline acts as a ceiling for the price, gradually squeezing it downward toward the horizontal support line. The pattern gets its name from this unique shape—a triangle with its hypotenuse sloping downwards, forming the basis of the descending triangle chart pattern.
The psychology behind the descending triangle is a fascinating visual narrative of the battle between buyers and sellers. The horizontal support line represents a solid line in the sand where buyers are attempting to defend a specific price level. Each time the price falls to this level, buying pressure steps in and pushes it back up. However, the descending resistance line tells a different story. It shows that the strength of the sellers is growing. They are successfully pushing the price lower on each rebound, creating a sequence of lower highs. This dynamic signals that the bears are gradually overpowering the bulls, and that the buyers’ defense at the support line is being tested with increasing frequency and pressure. The pattern is essentially a period of consolidation where the market is taking a breath before a potential major move. The descending triangle pattern formation typically occurs during an existing downtrend, reinforcing its role as a bearish continuation pattern and highlighting the significance of the regular descending triangle pattern in technical analysis.
A critical component of a valid descending triangle is volume. As the price action moves within the triangle, the trading volume typically diminishes; volume declines are a common characteristic during the formation of a regular descending triangle pattern. This decline in volume indicates that both buyers and sellers are waiting for a clear direction, leading to a period of market indecision. The squeeze continues until the price reaches the apex of the triangle, the point where the two trendlines converge. At this point, a decisive move is imminent. The pattern concludes when the price finally breaks out of the formation. A break below the horizontal support line, a level that has held up multiple times, is a powerful signal that the buyers’ resolve has finally broken and the bears have won the battle. This breakout is what confirms the bearish bias and sets the stage for a new trend, making the descending triangle such a valuable pattern for traders to identify.
For a pattern to be considered valid, it should have at least two touches of the horizontal support line and two touches of the descending resistance line. More touches on both trendlines tend to increase the pattern’s reliability, as it demonstrates that the market is clearly respecting those levels. A triangle that is too wide or too narrow may be less reliable. A good rule of thumb is that the pattern should take a reasonable amount of time to form, allowing the market psychology to fully play out. A descending triangle that forms over several weeks on a daily chart will generally be more reliable and significant than one that forms over a few hours on a 15-minute chart. The longer the timeframe, the more powerful the signal, as it reflects the consensus of a larger number of market participants. The anticipation builds as the price converges, and a patient trader waits for the final, telling sign of the breakout. Understanding the descending triangle chart pattern and its components is essential for accurate technical analysis.
What is a Descending Triangle Pattern?
A descending triangle pattern is a classic bearish chart pattern that often signals the continuation of a downward trend. This triangle pattern forms when the price action creates a series of lower highs, marked by a descending upper trendline, while repeatedly finding support at a flat horizontal support line. The result is a triangle shape, with the upper trendline sloping downward and the lower trendline remaining horizontal. In technical analysis, the descending triangle pattern is used to identify growing selling pressure and a potential breakdown below support. When this chart pattern appears, it often points to an increased likelihood of a bearish move, making it a valuable tool for traders looking to capitalize on short-selling opportunities or to anticipate further declines. The clear structure of the descending triangle—defined by its descending upper trendline and horizontal support line—makes it easy to spot on a price chart and highly useful for predicting future price movements.
Psychology Behind the Pattern
The descending triangle is a visual representation of a market in a state of indecision and eventual capitulation. The psychology behind its formation is a fascinating battle between supply and demand. Initially, the market might be trending downward, or it may have just experienced a significant drop. This is where the sellers (bears) are in control.

As the price falls, it hits a level where buyers (bulls) see an opportunity to get in at a “discount.” They step in, buying up the asset and creating a support level. This is the flat bottom of the triangle. Each time the price falls to this level, buyers are there to scoop it up, preventing a breakout. However, the rallies that follow these support tests are becoming weaker and weaker. This is shown by the descending resistance line. Why are these rallies getting weaker? Because the sellers are growing in confidence. Instead of waiting for the price to hit a higher level, they are willing to unload their positions at progressively lower prices. This suggests that their conviction that the market is going to fall is strengthening.

Eventually, the pressure becomes too much. The buyers at the support level, who have been consistently absorbing the selling pressure, finally give way. A surge of selling volume, often from those who had been defending the support and those new sellers who were waiting for the break, pushes the price decisively below the flat support line. This breakdown is often accompanied by a significant increase in trading volume, confirming the pattern and signaling the start of a new, powerful downtrend. This move can also trigger stop-loss orders from long positions, adding fuel to the fire and accelerating the decline.
Once the pattern completes and the support level is broken, a continued downward trend is often observed as sellers take control.
Identifying Key Components
To effectively identify and trade a descending triangle, you need to understand its three primary components:
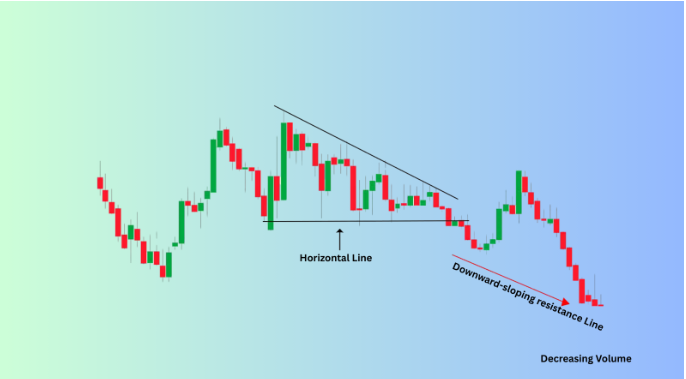
- The Flat Support Line: This is the horizontal line at the bottom of the triangle. It’s the price level where the asset repeatedly finds support. The more times the price touches and bounces off this line, the stronger its significance. A minimum of two touches is required to draw the line, but three or more provide greater confirmation. The descending triangle pattern bearish is recognized for its strong bearish implications in technical analysis, often signaling a continuation of a downtrend.
- The Downward-Sloping Resistance Line: This is the upper trendline connecting a series of lower highs. It’s the visual proof that sellers are becoming more aggressive and are selling at lower prices with each successive rally. This line must have at least two points of contact to be considered valid.
- Decreasing Volume: During the formation of the triangle, trading volume typically decreases. This is a crucial characteristic. The contracting volume reflects the indecision and tightening of the price range. The market is “coiling,” waiting for a decisive move. The real confirmation of the pattern comes when a breakout occurs with a sharp increase in volume. A triangle pattern breakout strategy often relies on this volume confirmation to validate the breakout and execute trades accordingly. This surge in volume validates the breakout and suggests strong conviction behind the new trend.

Trading Strategies with Descending Triangle Patterns
The descending triangle is not just a tool for prediction; it is a blueprint for action. Once the pattern is identified, a trader can use it to formulate a clear, disciplined trading strategy with defined entry, exit, and risk management points. Many traders use a triangle with moving averages or a descending triangle with moving average indicators to confirm breakout signals and trend direction, increasing the reliability of their trades.
The most crucial part of this strategy is the pattern break, which is the point at which the bearish move is confirmed. A confirmed break removes much of the guesswork from trading and provides a high-probability entry point. Recognizing a triangle reversal pattern is also crucial, as it allows traders to adapt their strategies if the breakout occurs in the opposite direction.
Descending Triangle Pattern Breaks
A descending triangle pattern break occurs when the price breaks decisively below the horizontal support line, confirming a bearish breakout. The descending triangle pattern occur frequently during established downtrends, and when the descending triangle pattern appears, traders should be alert for a potential breakout. This is the moment a trader has been waiting for, as it provides the signal to enter a short position. The breakout is often accompanied by a significant increase in volume, which is a key confirmation signal. This spike in volume indicates that the breakout is not a temporary fluctuation but is backed by a large number of sellers entering the market, adding momentum to the downtrend. This strong selling pressure gives the move credibility and reduces the chance of a false breakout
To capitalize on the confirmed break, traders can use the descending triangle pattern break to enter short positions. When a descending triangle appears, it often signals a high-probability short-selling opportunity. A short position involves selling a financial instrument with the expectation that its price will fall, allowing the trader to buy it back later at a lower price and profit from the difference. A common entry strategy is to place a sell order just below the horizontal support line, or to wait for a breakout candle to close decisively below the support before entering.
Once a short position is entered, the next step is to set a target price. A simple and effective method for projecting the target price is to measure the vertical height of the triangle at its widest point (the beginning of the pattern) and project that distance downward from the breakout point. This method provides a clear, data-driven profit target for the trade.
Finally, the descending triangle pattern break is a critical component of the pattern, as it confirms the bearish trend. Without a clear and validated break, the pattern is just a period of consolidation. The breakout serves as the final piece of the puzzle, validating the preceding price action and offering a high-probability trade setup.
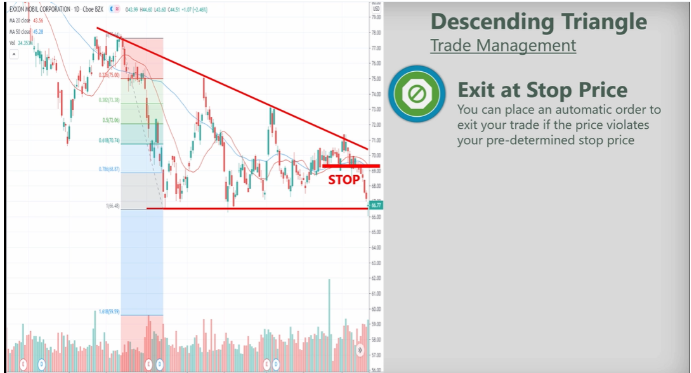
Risk Management
Beyond entry and exit points, a successful trading strategy requires robust risk management. The key to minimizing potential losses is to set a stop-loss order, which automatically closes a position if the price moves against you. For a descending triangle breakout, a logical stop-loss can be placed just above the horizontal support line, or above the high of the breakout candle. This placement ensures that if the breakout proves to be a false signal, the trader’s loss is limited. A false breakout occurs when the price briefly moves outside the pattern’s trendlines but quickly reverses back into the consolidation zone. These can be avoided by waiting for a strong, high-volume candle to close outside the pattern before entering a trade. Traders should also be aware of similar patterns, such as the falling wedge or falling wedges, which often signal a bullish reversal rather than a bearish continuation.
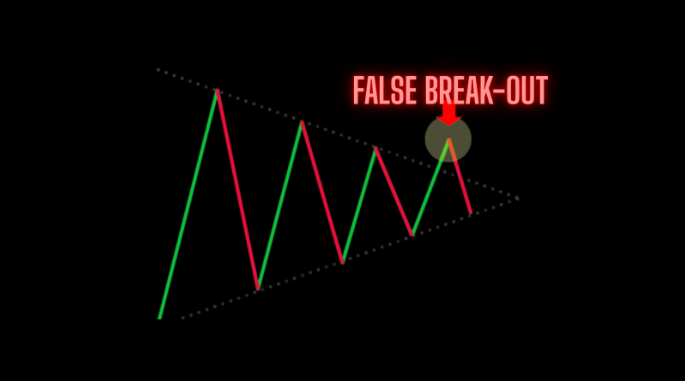
A common post-breakout event is the “retest.” This is when the price breaks below the support line but then rallies back to retest that same level from below before continuing its descent. This retest often turns the previous support into a new resistance level. For a patient trader, waiting for this retest and entering a position as the price bounces off the new resistance can provide an even higher-probability entry with a tighter stop-loss.
How profitable are Descending Triangle Patterns?
While no trading pattern can guarantee profits, descending triangle patterns are widely regarded as one of the more reliable and highly profitable formations in technical analysis. Their profitability stems from the clear and measurable nature of the pattern itself. The defined support and resistance lines, combined with the measurable profit target, provide traders with a structured trading plan. The descending triangle pattern profitable reputation is due to its high success rate in bearish markets, but traders should also be aware of the descending triangle pattern bullish scenario, which can occur in certain market conditions. However, the profitability of the pattern is not absolute; it is greatly enhanced when combined with other technical indicators and chart patterns. For instance, a trader might look for a bearish signal from the Relative Strength Index (RSI), indicating that the asset is overbought, or a bearish crossover on the Moving Average Convergence Divergence (MACD) indicator, to confirm the momentum of the downtrend.
The profitability of the pattern is not just a function of the chart itself, but also depends on various factors, including the trader’s skill level, market conditions, and risk management. A skilled trader will not only identify the pattern but will also wait for a confirmed, high-volume breakout and manage their risk with a carefully placed stop-loss. They will understand that a high-volatility market might lead to a more explosive breakout, but also a higher risk of a false breakout. They will also know to be cautious in a low-volume, low-liquidity market, where the breakout may not have the momentum needed to reach the profit target. Using descending triangles with heikin or triangles with heikin ashi can help traders confirm trend direction and breakout signals by smoothing price action and filtering out market noise. Proper risk management—including sizing positions appropriately and never risking more than a small percentage of their capital on a single trade—is what ultimately determines long-term profitability.

The beauty of the descending triangle is its versatility. Descending triangle patterns can be used in various markets, including forex, stocks, and commodities. The underlying principles of supply and demand are universal, and the visual representation of this battle appears in every market. Whether a trader is analyzing the EUR/USD pair, a tech stock, or the price of gold, the pattern’s formation and implications remain the same. The descending triangle reversal pattern can sometimes signal a shift to a bullish trend, especially when combined with other technical indicators. This makes the descending triangle a versatile and valuable tool for traders who operate across different asset classes.

Ultimately, the profitability of descending triangle patterns makes them a popular choice among traders. They offer a clear-cut setup with a high probability of success when traded correctly. Their well-defined nature provides a sense of certainty in a chaotic market, empowering traders to make confident decisions. While they are a powerful tool, they should always be part of a larger trading strategy that includes sound risk management and a deep understanding of market dynamics.
To illustrate the profitability potential, consider a hypothetical scenario. A descending triangle forms on the daily chart of the EUR/USD pair over a three-week period. The horizontal support is at 1.1000, and the descending resistance begins at 1.1200. The height of the triangle is 200 pips. A trader, having identified the pattern, waits for a breakout. When the price breaks below 1.1000 on high volume, they enter a short position. They place a stop-loss just above the horizontal support at 1.1020 and a profit target 200 pips below the breakout, at 1.0800. The trade unfolds over the next several days, reaching the target and yielding a 10:1 risk-to-reward ratio. This example highlights how the pattern provides a clear roadmap for a high-reward, managed-risk trade.
Beyond just the profit potential, descending triangles also offer immense value in providing clarity. In a market full of noise and random movements, this pattern can cut through the chaos, giving traders a clear signal to act or to stand aside. It provides a logical framework for analysis, helping traders avoid emotional decisions. This ability to bring order to a chaotic market is perhaps its greatest value, as disciplined trading is the ultimate key to long-term success.
Ascending Triangle Pattern
An ascending triangle pattern is a bullish chart pattern that signals the potential for an upward price breakout. This triangle pattern forms when the price makes a series of higher lows, creating an ascending lower trendline, while repeatedly encountering resistance at a flat horizontal upper trendline. The result is a triangle shape that slopes upward, reflecting increasing buying pressure as each dip is met with stronger demand. In technical analysis, the ascending triangle is seen as a bullish continuation pattern, often appearing during an uptrend and suggesting that buyers are gaining control. When the price finally breaks above the resistance line, it typically signals the start of a new upward move. Traders use the ascending triangle pattern to identify potential buying opportunities and to set entry and exit points based on the breakout above the upper trendline.
Descending Triangle Pattern vs Ascending Triangle Pattern
The descending triangle pattern and the ascending triangle pattern are two fundamental triangle patterns in technical analysis, each with distinct implications for price movement. The descending triangle pattern is a bearish pattern, characterized by a downward-sloping upper trendline and a flat horizontal support line, indicating that sellers are becoming more aggressive and a downward trend may continue. In contrast, the ascending triangle pattern is a bullish pattern, featuring an upward-sloping lower trendline and a flat resistance line, suggesting that buyers are gaining strength and an upward trend is likely. The key difference between these triangle patterns lies in the direction of the trendlines and the expected breakout direction: the descending triangle typically leads to a bearish breakout, while the ascending triangle points to a bullish breakout. Both patterns are essential tools in technical analysis, helping traders identify high-probability trading opportunities and anticipate future price movements.
Conclusion
The descending triangle is a powerful and reliable bearish continuation pattern that every technical trader should have in their arsenal. It serves as a visual forecast of a potential downturn, providing a structured and clear-cut framework for a high-probability trade. By recognizing its distinct formation—a flat support line and a descending resistance line—traders can anticipate a decisive breakout. The key to successful trading with this pattern lies in confirming the breakout with a significant increase in volume and using proper risk management techniques, such as placing a stop-loss just above the horizontal support line. While the profitability of descending triangles is significant, it’s crucial to remember that they are most effective when combined with other technical indicators and a solid understanding of market conditions. Mastery of this pattern, like any skill in trading, comes with practice and a disciplined approach.

Ready to elevate your trading strategy by mastering the dynamics of the forex market?
Understanding liquidity is just the first step. Maverick Trading & Currencies offers expert guidance and personalized coaching to help you develop and execute strategies for any market condition.