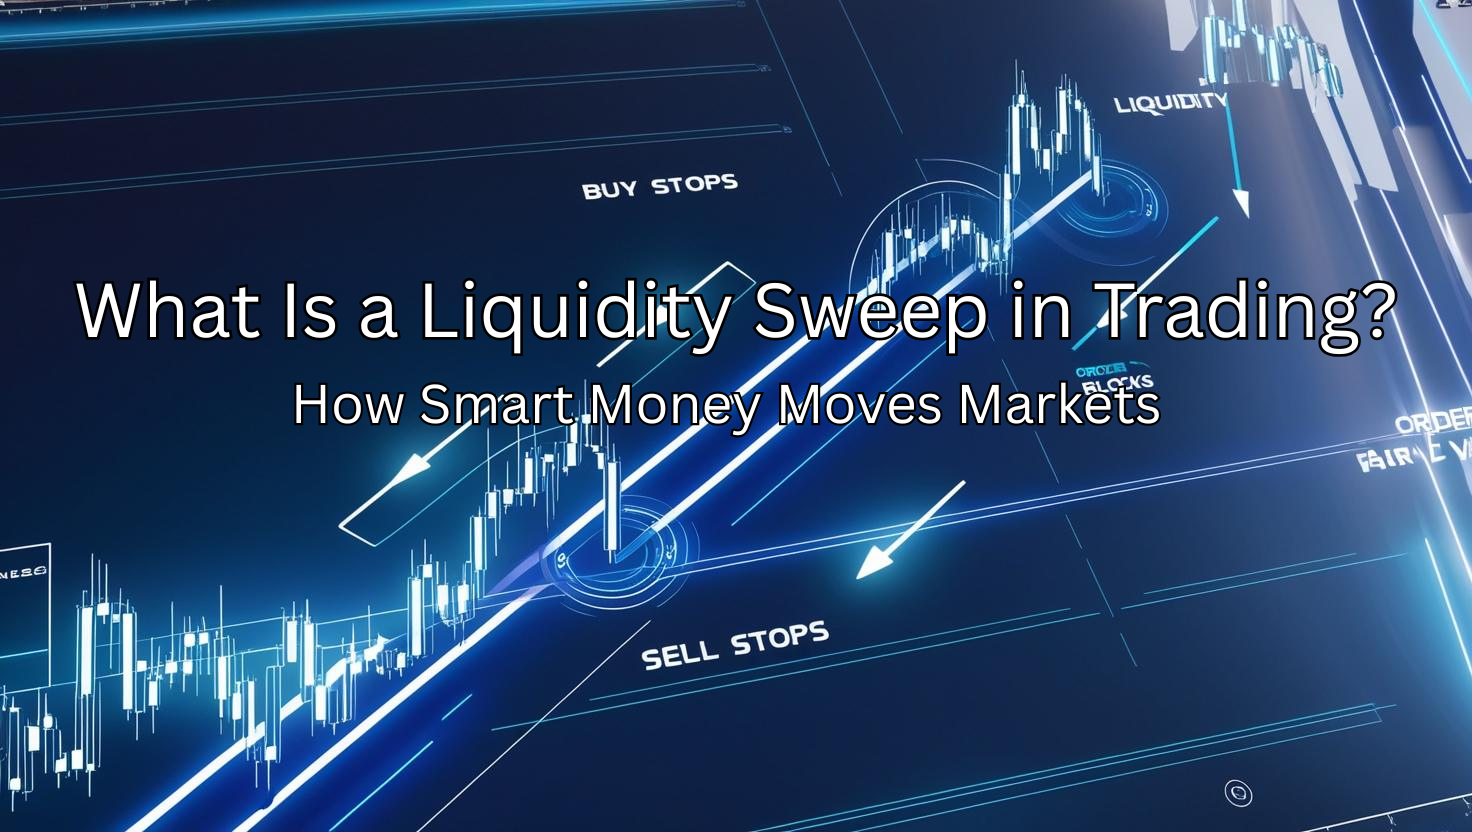
What Is a Liquidity Sweep in Trading? How Smart Money Moves Markets
In the high-stakes arena of Forex trading, the quest for a consistent edge often leads traders down intricate paths of technical analysis and strategic thinking. What if there was a method to peer behind the curtain of market volatility, to understand the subtle dance between large institutions and the collective sentiment of retail traders?
Market makers play a critical role in influencing price movements and market dynamics. They are often large entities that facilitate trades, providing liquidity and stabilizing the market, and they play a significant part in strategies like liquidity grabs and sweeps, which aim to capitalize on stop-loss orders to enhance trading effectiveness.
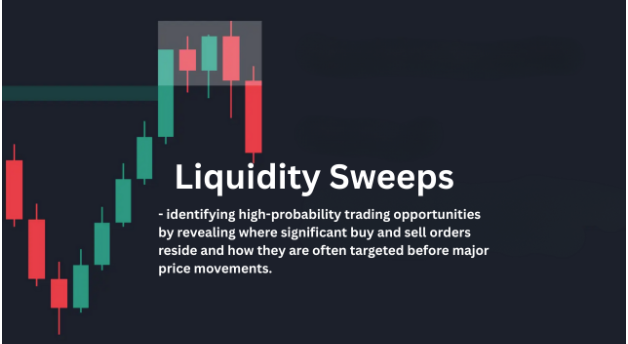
The concept of a liquidity sweep offers precisely this potential. It’s a sophisticated technique that, when mastered, can illuminate high-probability trading opportunities by revealing where significant buy and sell orders reside and how they are often targeted before major price movements.
Introduction to Liquidity in Trading
Liquidity is the lifeblood of any financial market, and the Forex market, being the largest and most liquid globally, is no exception. Liquidity in financial markets influences the ease of buying and selling assets, which in turn affects trading strategies and market stability. Understanding where and how liquidity congregates is paramount for any trader seeking to navigate its complexities successfully.
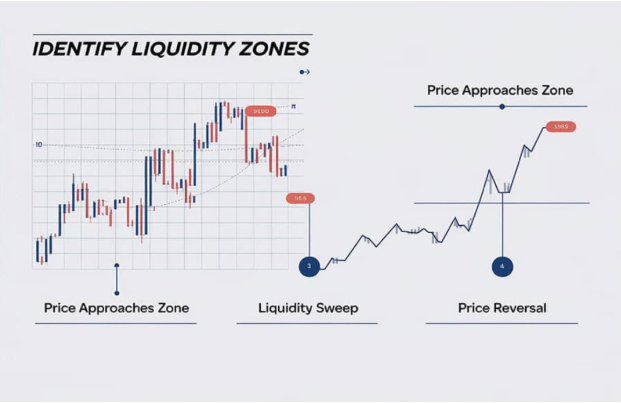
Understanding Liquidity Zones
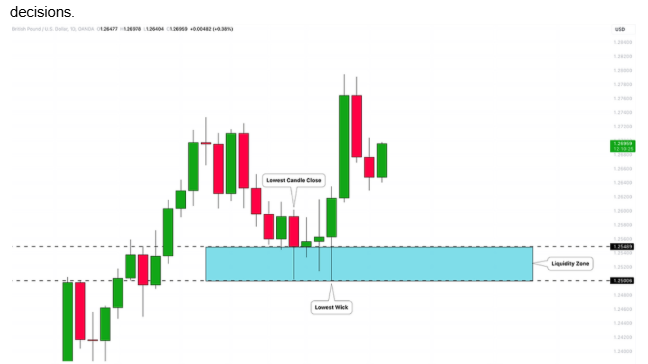
Liquidity zones are specific price levels or areas on a chart where a significant concentration of buy or sell orders exists. These orders can take various forms, including pending buy and sell limit orders, stop-loss orders placed to protect existing positions, and take-profit orders waiting to be triggered. Identifying key liquidity zones as critical components within trading strategies is essential, as they highlight significant points of support and resistance. These zones often form at psychologically significant levels and areas of previous price action.
Key areas where liquidity zones tend to develop include:
- Previous Highs and Lows (Swing Points): These represent obvious levels where traders might place stop-loss orders just beyond or take-profit orders just before.
- Key Support and Resistance Levels: Well-defined horizontal support and resistance levels attract a multitude of orders, both from breakout traders and those playing reversals.
- Order Blocks: These are specific price ranges where large institutional orders were likely placed, and price often revisits these areas. Liquidity can be found both within and around these blocks.
- Fair Value Gaps (FVG) / Imbalances: These are price inefficiencies where rapid price movement has left gaps with minimal trading activity. These gaps can act as magnets for price and contain resting orders.
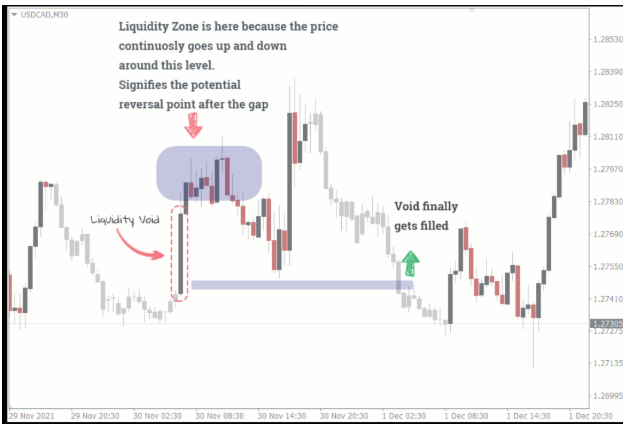
Large market participants, often referred to as “smart money,” require substantial liquidity to execute their large positions without causing significant price slippage. These liquidity zones provide the necessary volume for them to enter or exit trades effectively. Understanding where these zones lie gives astute traders a potential edge in anticipating the next market move.
What are the models of liquidity trading?
Liquidity trading isn’t a rigid, singular strategy but rather a comprehensive framework for analyzing price action through the lens of liquidity. It encompasses various trading strategies that enhance traders’ tactics for entering and exiting positions by applying liquidity concepts, such as liquidity sweeps and voids. These strategies share the common goal of understanding and capitalizing on how price interacts with areas of high order concentration.
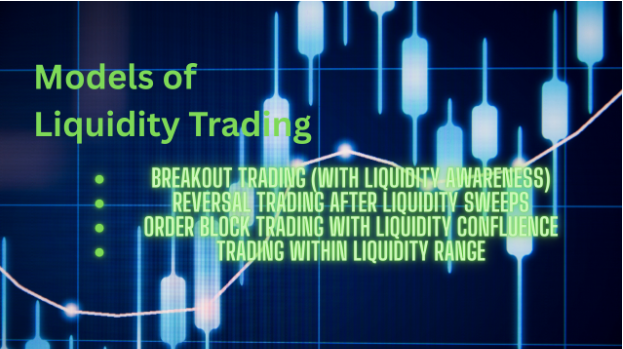
Several models or approaches fall under the umbrella of liquidity trading:
- Breakout Trading (with Liquidity Awareness): While traditional breakout trading focuses on price breaking through key levels, a liquidity-aware approach considers the potential for false breakouts designed to sweep liquidity before a genuine move.
- Reversal Trading after Liquidity Sweeps: This is a core concept we will delve into further. It involves identifying instances where price temporarily moves beyond a liquidity zone, collects resting orders, and then reverses sharply, presenting a potential entry opportunity in the opposite direction.
- Order Block Trading with Liquidity Confluence: Combining the identification of order blocks with an understanding of where liquidity has been swept or is likely to be targeted can lead to high-probability setups.
- Trading within Liquidity Ranges: Identifying ranges where significant buying and selling pressure exists and trading within these ranges, anticipating sweeps of the range highs or lows.
It’s crucial to understand that these models often overlap and are most effective when used in conjunction with other technical analysis tools, such as market structure analysis, Fibonacci retracements, and volume analysis.
What is a liquidity sweep?
A liquidity sweep is a specific price action pattern where the price temporarily moves beyond a significant liquidity zone, such as a previous high or low, a key support or resistance level, or an identified liquidity pool. A liquidity sweep targets a specific price level to initiate stop orders, leading to a price reversal. The primary purpose of this move is to trigger and collect the resting orders (stop losses, take profits, and pending entries) that are clustered around these levels.
The defining characteristic of a liquidity sweep is the subsequent reversal of price back in the direction of the prevailing trend or a newly emerging direction. This reversal often occurs relatively quickly, leaving behind a prominent wick or shadow on the candlestick chart that pierced the liquidity zone. This wick represents the temporary excursion beyond the level where liquidity was targeted. Liquidity sweeps are often interpreted as “smart money” tactics to accumulate positions at better prices or to induce retail traders into premature positions before the market moves in the opposite direction.

Liquidity Sweeps in Trading
Understanding the broader context of liquidity trading is essential for appreciating the significance of liquidity sweeps. Sharp price fluctuations caused by large trades, known as market movements, can create both opportunities and challenges for traders.
What is liquidity trading?
Liquidity trading is a strategic approach that centers on identifying areas in the market where substantial buying or selling interest is concentrated and then anticipating how price will interact with these areas. It’s based on the understanding that large institutional traders need significant liquidity to execute their large orders without causing excessive slippage, and they often seek out areas where retail traders have clustered their orders.
By focusing on liquidity, traders can gain a deeper understanding of potential price movements and avoid being caught on the wrong side of the market. It helps in:
- Identifying Potential Reversal Points: Liquidity sweeps often precede significant price reversals.
- Avoiding Stop-Loss Hunting: Understanding where stop losses are likely placed can help traders position their own stops more strategically.
- Following Institutional Order Flow: Liquidity sweeps can offer clues about the intentions and actions of large market participants.
The trading psychology behind liquidity sweeps
The effectiveness of liquidity sweeps is deeply rooted in trading psychology. Retail traders often place their stop-loss orders at seemingly logical and obvious levels, such as just below recent lows or just above recent highs. These areas become attractive targets for liquidity sweeps.
Furthermore, the fear of missing out (FOMO) can lead traders to enter positions prematurely near these critical levels, adding to the pool of pending orders. Smart money can exploit this collective behavior by engineering temporary price movements to trigger these stops and entries, effectively accumulating positions at favorable prices before a more significant move in their intended direction.
Liquidity sweeps can lead to sudden price movements and increased volatility, influencing traders’ strategies and decision-making processes.
The sharp reversal following a liquidity sweep can often trap traders who entered on the initial break, leading to frustration and losses.
Is liquidity a good trading strategy?
Employing a strategy that incorporates liquidity analysis can be highly advantageous, but it’s not a foolproof or standalone solution. Managing risk is a critical component in trading strategies, particularly in the context of liquidity grabs and sweeps. Effective risk management techniques, such as proper stop-loss settings and accounting for market volatility, are essential for protecting capital and navigating the inherent challenges of trading in volatile markets.
Potential Advantages:
- High Probability Setups: When a valid liquidity sweep occurs at a significant level and is followed by strong confirmation, it can offer high-probability trading opportunities.
- Clear Invalidation Levels: The level that was swept often serves as a clear invalidation point for the trade.
- Understanding Institutional Intent: Analyzing liquidity can provide insights into the potential actions of large market participants.
Challenges:
- Requires Experience and Nuance: Identifying genuine liquidity sweeps requires practice and a deep understanding of market structure.
- Not Every Move Beyond a Level is a Sweep: Distinguishing between a genuine sweep and a breakout is crucial.
- Confirmation is Essential: Relying solely on a sweep without further confirmation can lead to false signals.

Therefore, while liquidity analysis is a powerful tool, it is most effective when integrated with other forms of technical analysis to build a robust trading strategy.
What does a sweep mean in trading?
In the context of trading, a sweep specifically refers to the action of price briefly moving beyond a significant level of support, resistance, or a defined liquidity zone. This movement is typically characterized by a quick retracement back in the opposite direction. The “sweep” implies a targeted action to collect orders resting at that level rather than a sustained breakout.
A notable increase in trading volume during a liquidity sweep may signal a major market event that could lead to substantial price reversals or continuations.
It’s important to differentiate a sweep from a genuine breakout, where price decisively moves beyond a level and continues in that direction with strong momentum. A sweep often lacks this sustained follow-through.
What is the liquidity sweep rule?
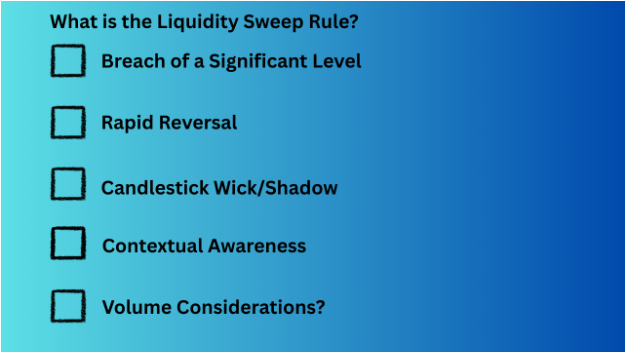
It’s important to clarify that there isn’t a single, universally codified “liquidity sweep rule” in the way that some technical indicators have specific formulas. Instead, identifying a liquidity sweep relies on recognizing a confluence of characteristics and principles:
- Breach of a Significant Level: Price must move beyond a clearly identified liquidity zone (previous high/low, key S/R).
- Rapid Reversal: The move beyond the level is typically short-lived, with price quickly reversing back.
- Candlestick Wick/Shadow: The candlestick that breaches the level often leaves a prominent wick or shadow, indicating the temporary excursion.
- Contextual Awareness: The sweep should make sense within the broader market structure and trend.
- Volume Considerations (Optional): Sometimes, a spike in volume during the sweep followed by diminishing volume on the reversal can add confluence.
Monitoring price interactions with liquidity zones is crucial for market identifying. Traders can use these observations to make informed decisions about their positions based on anticipating market behavior at critical levels.
Identifying a liquidity sweep is more of an art and a skill developed through observation and experience rather than strictly adhering to a rigid set of rules.
Is a liquidity sweep bullish?
A liquidity sweep, in itself, is neither inherently bullish nor bearish. The bullish or bearish implication arises from the direction of the reversal following the sweep.
- Bullish Liquidity Sweep: This occurs when price moves below a significant low (sweeping sell-side liquidity, including stop losses of long positions and potential sell limit orders) and then reverses upwards. This suggests that the downward move was a temporary measure to collect orders before an upward push.
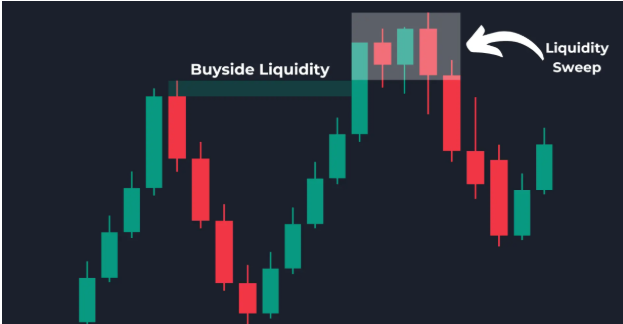
- Bearish Liquidity Sweep: Conversely, this happens when price moves above a significant high (sweeping buy-side liquidity, including stop losses of short positions and potential buy limit orders) and then reverses downwards. This indicates that the upward move was to gather liquidity before a downward move.
Understanding the relationship between liquidity sweeps and liquidity runs is significant as these concepts have distinct implications on market trends. Recognizing these differences can provide valuable insights into current market dynamics.
Therefore, the bullish or bearish signal is determined by the direction of the price action after the liquidity has been swept.
Leverage and Liquidity Sweeps
Leverage and liquidity sweeps are two concepts that are closely related in the world of trading. Leverage refers to the use of borrowed capital to increase the potential return on investment, while liquidity sweeps refer to the rapid execution of trades to take advantage of market opportunities.
How leverage amplifies liquidity sweeps
When traders use leverage to execute liquidity sweeps, they can amplify their potential returns. However, this also increases the risk of significant losses if the trade does not go in their favor. Leverage can amplify liquidity sweeps by allowing traders to execute larger trades than they would be able to with their own capital. This can lead to sharper price movements and increased market volatility. For example, a trader using a leverage of 10:1 can execute a trade that is 10 times larger than their own capital, which can lead to a significant impact on the market.
Risks and rewards of leveraging in liquidity trading
While leverage can amplify the potential returns of liquidity sweeps, it also increases the risk of significant losses. Traders must carefully manage their risk when using leverage to execute liquidity sweeps, as the potential for losses can be substantial. To manage risk, traders can use stop-loss orders, position sizing, and other risk management techniques. For instance, a trader can set a stop-loss order at a specific price level to limit their potential losses if the trade does not go in their favor.
Identifying Liquidity Sweeps
Developing the ability to accurately identify liquidity sweeps is a crucial skill for any trader employing this methodology.
How do you identify a liquidity sweep?
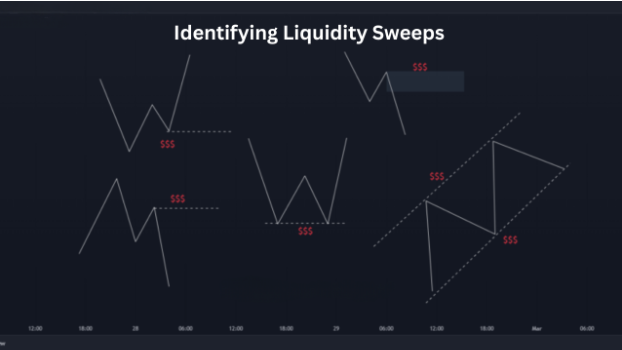
Identifying a liquidity sweep involves a combination of technical analysis and observational skills:
- Pinpoint Key Liquidity Levels: Begin by marking significant previous highs and lows, swing points, well-respected support and resistance levels, and potential order blocks on your charts. These are the areas where liquidity is likely to be concentrated. Locating liquidity zones within market trends, identifying key areas marked by swing points and consistent support and resistance levels, is crucial for traders to make informed decisions.
- Watch for Price Breaches with Weak Follow-Through: Pay close attention when price approaches these key levels and breaks beyond them. However, critically observe the momentum and sustainability of this breakout. A liquidity sweep often lacks strong, sustained momentum.
- Focus on Candlestick Patterns: Look for candlesticks that exhibit long wicks or shadows extending beyond the identified liquidity levels, with the candle body closing back within or near the previous range. These wicks are visual clues of a temporary price excursion to collect orders.
- Analyze Volume (Optional): While not always a definitive indicator, a potential scenario is a spike in volume during the initial breach of the level, followed by lower volume on the subsequent reversal. This can suggest that the move was driven by stop-loss triggers rather than genuine buying or selling interest.
- Consider Multiple Timeframes: Liquidity sweeps can occur on any timeframe. Observing confluence across multiple timeframes can increase the reliability of the identification. A sweep on a lower timeframe that aligns with a key level on a higher timeframe can be particularly significant.
- Contextual Analysis is Vital: Always consider the broader market structure, the prevailing trend, and any relevant news events. A sweep that occurs against the dominant trend might be a signal of a potential trend reversal.
What is the difference between liquidity run and sweep?
The key distinction between a liquidity run and a liquidity sweep lies in the sustainability and intent of the price movement beyond a liquidity zone.
- Liquidity Sweep: As discussed, this is a brief, often sharp move beyond a liquidity level, followed by a quick reversal. The primary intention appears to be to collect resting orders before price moves in the opposite direction.
- Liquidity Run: This involves a more sustained and often stronger move through a liquidity zone. While it might initially trigger some stop losses, the price continues to move in the direction of the “breakout,” indicating genuine buying or selling pressure and a potential continuation of the trend or a new trend initiation.
Gathering liquidity occurs when prices move decisively in one direction to target various liquidity zones before executing a significant market move. Identifying whether a move beyond a key level is a sweep or a run is crucial for determining the appropriate trading response. A lack of strong follow-through after breaking a level is a key characteristic of a potential liquidity sweep.
What’s the difference between liquidity sweep and liquidity grab?
In the realm of Forex trading, the terms liquidity sweep and liquidity grab are often used interchangeably to describe the same market phenomenon. Both terms refer to a price action where the market temporarily moves beyond a significant level to collect resting orders before reversing direction.
Traders can leverage liquidity sweeps as strategic tools within their trading strategies, emphasizing their role as indicators that enhance trading outcomes.
While some traders might attempt to draw subtle distinctions, suggesting that a “grab” might be a more aggressive or obvious manipulation, practically speaking, they both describe the same market behavior of targeting and collecting liquidity.
How to spot a liquidity grab?
As “liquidity grab” is synonymous with “liquidity sweep,” the methods for identifying one are identical. Focus on:
- Price temporarily breaching a key liquidity level.
- A subsequent rapid reversal of price.
- The presence of a significant wick or shadow on the relevant candlestick.
- Consider the overall market context and volume (if available).
To trade liquidity sweeps effectively, it is crucial to analyze market structure and order flow data. This involves identifying clusters of pending orders and using tools like volume profiles to spot high order density areas, which are critical for successful trading.
There is no distinct set of rules or indicators specifically for spotting a “liquidity grab” that differs from identifying a “liquidity sweep.”
What is the liquidity grab zone indicator?
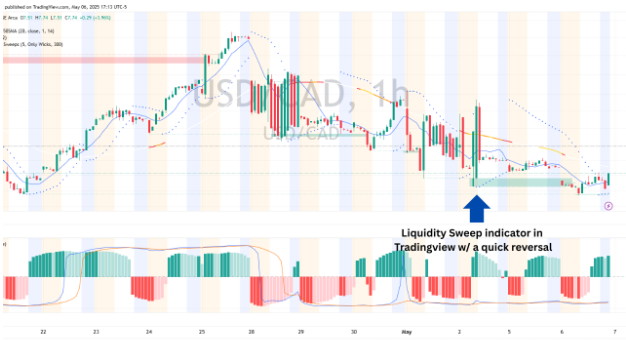
A liquidity grab zone indicator is a custom-built technical analysis tool designed to automatically identify potential areas where liquidity grabs (or sweeps) might occur. These indicators typically work by analyzing price action around significant levels, looking for specific candlestick patterns, volatility spikes, or other criteria that suggest a temporary move to collect orders.

Changes in market structure, including the introduction of new trading platforms, can lead to fluctuations in liquidity over time. The characteristics of different markets, such as forex or cryptocurrency, can affect how liquidity events occur and are perceived by traders.
While such indicators can be helpful in highlighting potential areas of interest, it’s crucial to understand that they are not foolproof. They should be used as a tool to aid analysis rather than as a standalone trading signal. Traders should always apply their own understanding of market structure and confirm potential liquidity grabs with other forms of technical analysis.
What to do after a liquidity sweep?
Identifying a liquidity sweep is only the first step. The crucial part is knowing how to react and potentially capitalize on this market behavior. Liquidity sweeps often lead to significant price movements once the sweeping process is completed, allowing traders to strategically capitalize on the pronounced changes in market prices:
- Wait for Confirmation: Do not immediately enter a trade after witnessing a sweep. Wait for clear confirmation of the reversal in the expected direction. This confirmation could come in the form of a strong opposing candlestick, a break of a short-term counter-trendline, or the formation of a reversal chart pattern.
- Identify Potential Entry Points: Once confirmation is established, look for suitable entry points based on your trading strategy. This could be at the close of the confirmation candle, on a retracement to a key level (e.g., the swept level or a nearby order block), or upon the break of a significant structure point in the direction of the anticipated move.
- Set Strategic Stop-Loss Orders: Place your stop-loss order strategically to protect your capital. For a bullish liquidity sweep, a logical placement is below the low of the sweep candle. For a bearish sweep, it would be above the high of the sweep candle.
- Define Take-Profit Targets: Identify potential profit targets based on market structure, previous highs or lows, Fibonacci levels, or other relevant technical analysis tools. Aim for targets that offer a favorable risk-to-reward ratio.
How to spot liquidity pools?
Liquidity pools are areas on a price chart where a large number of orders are concentrated. Identifying these pools can help anticipate potential targets for liquidity sweeps. Common areas where liquidity pools form include:
- Equal Highs and Lows: These are particularly attractive areas for stop-loss orders. Traders often place their stops just beyond these seemingly obvious levels.
- Trendlines: Stop-loss orders can accumulate above descending trendlines (for short positions) and below ascending trendlines (for long positions). A break of the trendline can trigger a cascade of these stops.
- Chart Pattern Breakout Levels: Traders anticipating breakouts often place buy-stop orders above resistance levels of patterns like triangles or flags, creating a pool of buy orders. Similarly, sell-stop orders can accumulate below support levels.
- Psychological Round Numbers: Price levels ending in 00 or 50 (e.g., 1.2000, 1.1550) often attract a significant number of limit and stop orders due to their psychological significance.
By identifying these areas of concentrated orders, traders can anticipate potential liquidity sweeps targeting these pools.
Fair Value Gaps and High Liquidity Markets
Fair value gaps and high liquidity markets are two concepts that are closely related to liquidity sweeps. Fair value gaps refer to areas on a chart where the price has not yet reached, while high liquidity markets refer to markets with a high level of trading activity.
Understanding fair value gaps in relation to liquidity sweeps
Fair value gaps can be used to identify potential areas where liquidity sweeps may occur. When a fair value gap is identified, traders can look for signs of a liquidity sweep, such as a rapid increase in trading volume or a sharp price movement. High liquidity markets are more prone to liquidity sweeps, as there are more traders and market participants actively buying and selling. For example, a fair value gap in a high liquidity market such as the EUR/USD forex pair can be a potential area for a liquidity sweep, as there are many traders and market participants actively buying and selling in this market.
In high liquidity markets, fair value gaps can be quickly filled by the market, leading to rapid price movements. Traders can use technical analysis techniques, such as chart patterns and indicators, to identify fair value gaps and potential liquidity sweeps. By understanding fair value gaps and high liquidity markets, traders can better navigate the markets and make more informed trading decisions. Additionally, traders can use tools such as volume profile and market depth analysis to identify potential liquidity zones and anticipate liquidity sweeps.
To illustrate this concept, let’s consider an example of a fair value gap in a high liquidity market. Suppose we are trading the EUR/USD forex pair, and we identify a fair value gap at the 1.1000 price level. We can look for signs of a liquidity sweep, such as a rapid increase in trading volume or a sharp price movement, and use technical analysis techniques to confirm the trade. By understanding fair value gaps and high liquidity markets, we can increase our chances of success in trading liquidity sweeps.
In conclusion, leverage and liquidity sweeps, as well as fair value gaps and high liquidity markets, are important concepts in trading that can help traders navigate the markets and make more informed trading decisions. By understanding these concepts and using the right tools and techniques, traders can increase their chances of success in trading liquidity sweeps.
Final Thoughts on Liquidity Sweeps
Mastering the concept of liquidity sweeps can provide Forex traders with a significant edge in understanding market dynamics and identifying high-probability trading opportunities. By recognizing the subtle clues left on price charts when large players target areas of concentrated orders, traders can position themselves to potentially profit from the subsequent reversals. Understanding liquidity zones, differentiating between sweeps and runs, and applying effectively.
Mastering liquidity sweeps requires ongoing analysis, adaptability, and robust risk management to succeed in trading activities.

Ready to explore this opportunity? Find out more at Maverick Trading