Tweezer Patterns: How to Predict Reversals
Have you ever placed a trade at the top of a rally—only to watch the market instantly reverse against you? If so, you’re not alone. Spotting reliable reversal signals is one of the trickiest parts of trading, and one of the most painful to miss. Enter the Tweezer Top pattern—a candlestick formation that’s often overlooked but can serve as a precise warning shot that momentum is about to shift.
The Tweezer Top is rooted in Japanese candlestick charting techniques, which were introduced and popularized in the West by Steve Nison through his influential book ‘Japanese Candlestick Charting Techniques.’ Understanding its origins highlights the significance of this approach for technical analysis and trading strategies.
Many traders struggle to recognize this pattern in real time or use it correctly. They either jump in too early or fail to confirm the move, leading to frustrating losses. This blog post is your guide to mastering the Tweezer Top. You’ll learn how to identify it, interpret it, and implement it with confidence—so you stop getting caught at the highs and start anticipating the turn.
What Is a Tweezer Top Pattern?
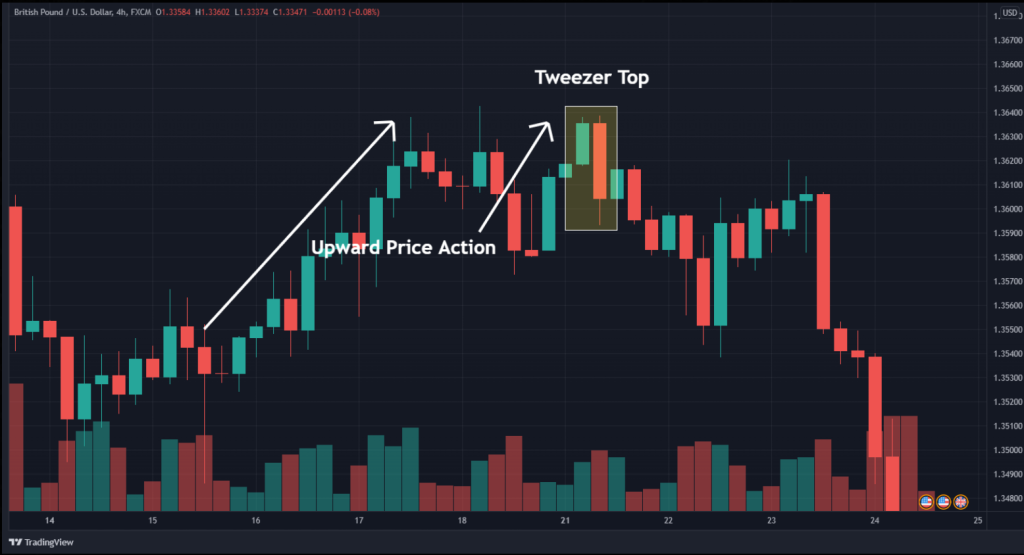
Infographic of uptrend tweezer top
A Tweezer Top is a bearish candlestick reversal pattern that signals the potential end of an uptrend. This pattern consists of two candlesticks—usually one bullish and one bearish—with nearly identical highs. This suggests that the market hit a strong resistance level and failed to break through it, despite initial momentum.
The first candlestick is typically a bullish candlestick, showing that buyers initially had control. The second candle opens at or near the previous high but reverses direction and closes lower, signaling that sellers are stepping in with force.
The Tweezer Top is a classic example of a tweezer candlestick pattern. Tweezer candles are used by traders to spot potential reversals by analyzing their visual characteristics and the relationship between the two candlesticks.
This pattern is often more reliable when it appears after a sustained bullish move or at a major resistance level. While simple on the surface, its power lies in the shift in market psychology—buyers lose conviction while sellers gain confidence.
Like other reversal patterns such as the Morning Star, the Tweezer Top should not be traded in isolation. It becomes most effective when combined with context—like volume analysis, liquidity zones, or institutional trading concepts.
Understanding the Tweezer Top Structure
At first glance, the Tweezer Top might seem like a coincidence—two or more candlesticks with similar highs. But when viewed through the lens of market psychology and structure, it reveals much more. The formation typically occurs at the end of an uptrend and signals potential bearish reversal. This pattern often forms after an ongoing uptrend, highlighting a shift in momentum at the peak of sustained bullish movement. Its strength lies in its symmetry and rejection.
The pattern is most often made up of two consecutive candlesticks:
- The first candle is bullish, showing continuation of upward momentum.
- The second candle opens at or very near the previous candle’s high and reverses to close bearish, signaling rejection at that level.
Key structural elements include:
- Equal highs or wicks at the top of both candles
- The presence of a long upper shadow on one or both candles, indicating strong market rejection of higher prices
- A visible shift in momentum between the two candles
- The pattern appearing after a sustained move upward, not during sideways chop
- Increased volume on the second candle, signaling institutional involvement or selling pressure
This identical or nearly identical high marks a clear resistance level where price was tested and rejected twice in a row. This price rejection is a key factor in validating the pattern. The failure to break higher suggests exhaustion among buyers and increasing pressure from sellers.
The Tweezer Top becomes even more powerful when viewed in the context of distribution phases, such as those outlined in the Wyckoff Method, or when paired with liquidity zones or breaker blocks.
For added conviction, traders often look for confirmation via a break of support or structure following the pattern. In this way, the Tweezer Toppattern signals a potential reversal, especially when confirmed by other technical tools. The pattern transitions from a visual cue to a strategic opportunity.
Is a Tweezer Top Bullish or Bearish?

A Tweezer Top is a bearish reversal pattern. The bearish tweezer top is a specific formation that appears at the end of an uptrend, signaling a potential trend reversal. Traders may also refer to this setup as a ‘bearish tweezer’, which serves as a bearish reversal indicator. It signals that the bullish momentum driving the uptrend has stalled, and sellers are beginning to take control. The repeated rejection at the same high price level suggests strong resistance and market hesitation to push higher.
While the pattern itself is bearish, it gains strength when combined with confirming factors—such as a break of support, overbought conditions, or confluence with a major resistance zone. Traders should be cautious not to act on the pattern alone. Without proper context and confirmation, a Tweezer Top could result in a temporary pullback rather than a true trend reversal.
What Does a Tweezer Top Indicate?

A Tweezer Top indicates a potential bearish reversal and a critical moment of indecision in the market. The tweezer candlestick is recognized for its ability to highlight shifts in market sentiment at key resistance levels. Specifically, it reflects a shift in control from buyers to sellers. After a bullish candle drives price higher, the market attempts to push beyond that level again—but fails. The second candle, opening near the previous high and closing lower, shows that upward momentum has stalled and resistance is holding.
This rejection at the same high suggests that institutional players or large-volume traders may be defending a price level. The market is likely reacting to a liquidity sweep, where stop-losses above resistance are triggered to fuel short positions—often a tactic seen in smart money trading. You can learn more about this setup in our guide on Liquidity Sweeps.
When this pattern forms near key technical levels—like previous highs, Fibonacci zones, or supply areas—it can serve as a high-probability entry for traders expecting a downside move.
What Is an Example of a Tweezer Top?
Imagine a 4-hour EUR/USD chart during an uptrend. A bullish candle forms with a high of 1.0935. The next candle opens at 1.0932, briefly spikes to the same high of 1.0935, then drops sharply and closes as a strong bearish candle at 1.0900. This setup is a classic example of top tweezer candlestick patterns, which involve two or more candles with matching highs. The identical highs at 1.0935 signal that resistance has held firm. The bearish close shows that sellers have gained momentum. If this occurs at a major resistance zone, with overbought RSI or rejection from a key Fibonacci level, it becomes a high-probability reversal setup. After identifying the pattern, traders might set a profit target at a nearby support or technical level to define their exit point. Add a trendline break or lower high, and you may have a trade-worthy entry
Imagine a 4-hour EUR/USD chart during an uptrend. A bullish candle forms with a high of 1.0935. The next candle opens at 1.0932, briefly spikes to the same high of 1.0935, then drops sharply and closes as a strong bearish candle at 1.0900. This setup is a classic example of top tweezer candlestick patterns, which involve two or more candles with matching highs. The identical highs at 1.0935 signal that resistance has held firm. The bearish close shows that sellers have gained momentum. If this occurs at a major resistance zone, with overbought RSI or rejection from a key Fibonacci level, it becomes a high-probability reversal setup. After identifying the pattern, traders might set a profit target at a nearby support or technical level to define their exit point. Add a trendline break or lower high, and you may have a trade-worthy entry
What Happens After a Tweezer Top?

After a Tweezer Top forms, the most common next step is a price reversal or pullback. If the pattern is valid and supported by context—such as forming at a strong resistance level or after a liquidity sweep—then the market often begins to shift downward.
Traders typically watch for a confirmation candle—a strong bearish candle that closes below the low of the Tweezer Top. For additional tweezer top confirmation, traders often look to technical indicators like RSI, moving averages, or MACD to validate the bearish reversal signal. Once confirmed, price may break through nearby support levels, signaling a shift in structure and opening the door for a larger move down. After a valid Tweezer Top, traders frequently set profit targets at key support areas or Fibonacci retracement levels to maximize gains and manage risk.
However, not every Tweezer Top leads to a major trend change. In weaker setups, the market might consolidate or only pull back slightly before resuming its uptrend. That’s why context, volume, and confirmation are essential.
Smart traders also monitor momentum indicators or use lower timeframes to fine-tune entries after a Tweezer Top forms.

What Is a Tweezer Bottom?
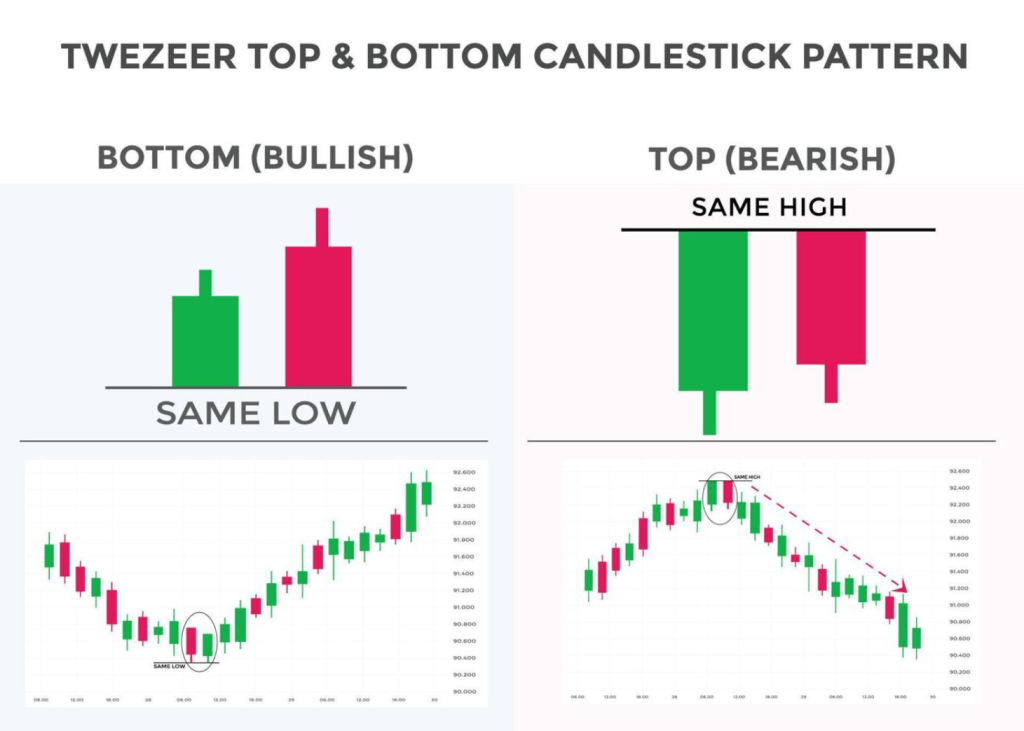
A Tweezer Bottom is the bullish counterpart of the Tweezer Top. The tweezer bottom pattern is a bullish reversal pattern that forms after a bearish trend. The bullish tweezer bottom consists of two candlesticks with nearly identical lows—one bearish, one bullish—signaling a potential reversal to the upside.
Like its opposite, it indicates that sellers failed to push past a support level. It often precedes a bullish reversal. Traders use the bullish tweezer as a signal to identify bullish reversals at the end of a downtrend.
Traders who master both patterns can more effectively trade reversals and identify exhaustion in either direction. But remember: context and confirmation still matter.
What Is the Tweezer Strategy in Trading?

The Tweezer strategy in trading is a reversal-based approach that uses the Tweezer Top (or Bottom) candlestick pattern to time market entries at potential turning points. Traders often use tweezer candlestick patterns, including both tops and bottoms, as part of their reversal strategies. Rather than relying on the pattern alone, successful traders use it as part of a confluence-based strategy.
To apply the Tweezer Top strategy:
- Identify the pattern at the end of an uptrend—look for two consecutive candles with nearly equal highs.
Recognize that tweezer patterns, such as the tweezer top or tweezer bottom, are key reversal indicators. - Check the context: Is the pattern forming near a known resistance level, supply zone, or after a liquidity sweep?
Pattern signals from tweezer patterns are more reliable when confirmed by other patterns or technical tools. - Wait for confirmation, such as a break below the low of the Tweezer Top or a shift in structure like a lower low.
If a price gap appears alongside the tweezer pattern, it can further validate the reversal signal. - Use indicators like RSI divergence, moving averages, or volume spikes to support your bias. Combining tweezer patterns with other patterns, such as engulfing or dark cloud cover, can improve trading accuracy.
- Set stop-loss orders just above the high of the Tweezer formation to manage risk effectively.
For best results, traders often use this strategy on higher timeframes like the 4-hour or daily chart, where the pattern holds more weight. The Tweezer strategy can be especially powerful when aligned with smart money concepts, trendline breaks, or market phases identified using tools like the Wyckoff method.
Disciplined execution is key—don’t chase the reversal, wait for the market to confirm your bias.
Best Time to Use the Tweezer Top

The Tweezer Top is most effective when it forms at either a market top or a significant resistance level. Specifically, look for this pattern when:
- Price is near a significant resistance level
- There’s a prior strong uptrend
- Volume increases on the second candle
- Major news events are approaching or just passed
Avoid using it in sideways markets or during low liquidity sessions (like late Fridays or holidays). Ideal timeframes include the 4-hour, daily, or weekly charts for stronger signals.
What Is a Tweezer Top and Bottom Strategy?

Some traders build reversal systems using both Tweezer Tops and Bottoms. The idea is to:
- Use Tweezer Tops to short tops of uptrends
- Use Tweezer Bottoms to long bottoms of downtrends
Traders rely on tweezer candlesticks to identify key reversal points in both bullish and bearish market conditions.
This strategy relies heavily on price context. For example, spotting a Tweezer Top at the top of a liquidity sweep or after a parabolic move provides better odds.
Pairing this with volume spikes, moving average alignment, and market structure shifts enhances the probability of success.
Using Technical Indicators with the Tweezer Top
While the Tweezer Top candlestick pattern is a classic signal for potential bearish reversals, its true power emerges when paired with other technical analysis tools. Relying solely on the pattern can lead to false signals, but combining it with technical indicators can help you filter out noise and zero in on high-probability trade setups.
One of the most effective tools to use alongside the Tweezer Top candlestick pattern is the Moving Average Convergence Divergence (MACD). When a Tweezer Top pattern forms and the MACD shows a bearish crossover—where the MACD line crosses below the signal line—it adds weight to the bearish reversal signal. This convergence of signals suggests that bearish momentum is building, increasing the likelihood of a trend reversal.
The Relative Strength Index (RSI) is another valuable indicator. If the Tweezer Top pattern forms while the RSI is in overbought territory or showing bearish divergence (price makes a higher high, but RSI makes a lower high), it signals that the upward price trend is losing steam. This weakening momentum, combined with the visual rejection of higher prices in the Tweezer Top, can provide a compelling case for a short trade.
Fibonacci retracement levels are also frequently used to pinpoint areas where a reversal might occur. If the Tweezer Top pattern forms near a key Fibonacci level—such as the 61.8% retracement—it suggests that the market is respecting a significant resistance zone. This confluence can make the bearish reversal signal even more reliable.
Volume analysis is another crucial aspect. When the second candle of the Tweezer Top pattern forms with a noticeable spike in volume, it indicates strong selling pressure and validates the bearish sentiment. On the other hand, if volume is low, the reversal signal may lack conviction, and the pattern could be less trustworthy.
Traders often look for additional confirmation from other candlestick formations. For example, if a bearish engulfing pattern or a dark cloud cover appears immediately after the Tweezer Top, it can further strengthen the reversal signal. Layering these technical indicators and candlestick patterns helps you build a robust case for entering a trade.
It’s important to consider the broader market context and prevailing market trends. The Tweezer Top candlestick pattern is most effective when it aligns with other technical analysis tools and forms at significant resistance levels or after an extended bullish advance. In the forex market and other asset classes, using longer timeframes—such as the 4-hour or daily chart—can improve the reliability of the pattern and reduce the impact of market noise.
By integrating the Tweezer Top pattern with technical indicators like MACD, RSI, Fibonacci retracement levels, and volume analysis, you can enhance your ability to spot potential trend reversals and make more informed trading decisions. Remember, the best trade signals come from a combination of candlestick formations, technical indicators, and a clear understanding of market context.
Common Mistakes When Trading the Tweezer Top

Despite its simplicity, the Tweezer Top can be misused. Here are the most common pitfalls:
- Jumping in too early: Without confirmation (such as a break of support), traders may enter too soon and get trapped in a fakeout.
- Ignoring context: A Tweezer Top in a consolidation range means little. Always check the overall trend and market structure.
- Wrong timeframes: On lower timeframes, the pattern forms frequently and unreliably due to noise.
- No risk management: Without proper stops, even a good setup can lead to large losses.
- Overconfidence: This pattern isn’t a guaranteed reversal—treat it as one tool in your trading toolbox.
Use confluence and stay disciplined. Trading is about stacking probabilities, not chasing perfection.
Conclusion
The Tweezer Top is a deceptively simple yet powerful pattern when used correctly. It reflects a precise shift in market sentiment—from bullish optimism to bearish control.
In this post, you’ve learned:
- How to identify and confirm the Tweezer Top
- Its relationship to liquidity sweeps and institutional levels
- How it compares to its bullish counterpart, the Tweezer Bottom
- When and where to apply it in your strategy
- The common mistakes to avoid
When paired with proper context and confirmation, the Tweezer Top can help you avoid chasing tops and start anticipating reversals.
Ready to Trade Like a Pro?
If you want to refine your chart-reading skills and learn how to apply candlestick patterns like the Tweezer Top with institutional precision, we invite you to book a free strategy call with Maverick.