The Morning Star Pattern: Mastering Bullish Trend Reversals

What if you could consistently spot the precise moment a downtrend is about to reverse, signaling a prime opportunity for significant gains? Many traders struggle to identify these critical turning points, key moments that often signal potential reversals, often entering too early or too late, missing out on potential profits or getting caught in false signals.
The market’s unpredictable nature can feel overwhelming, especially when trying to decipher complex candlestick formations. But what if there was a clear, three-candle pattern that has historically illuminated the path to bullish reversals, acting as a beacon of hope after a period of decline? This article will demystify the Morning Star pattern, equipping you with the knowledge to accurately identify its characteristics, understand its underlying psychology, and implement effective trading strategies. By the end, you’ll be able to confidently integrate this powerful bullish reversal signal into your technical analysis arsenal, enhancing your decision-making and potentially improving your trading performance.
Introduction to Morning Star
The Morning Star candlestick pattern is a powerful bullish reversal signal commonly observed at the bottom of a downtrend. When the morning star pattern appears, it indicates a potential shift in market momentum from bearish to bullish, often confirming other technical indicators and alerting traders to a possible reversal.
It’s a three-candlestick formation that, when correctly identified, can provide traders with an early indication that selling pressure is exhausting and buying interest is beginning to take hold. Its name evokes the image of the morning star (Venus) appearing before dawn, signaling the end of night and the beginning of a new day, much like it signals the end of a bearish phase and the potential start of a new bullish trend in the market.
Understanding this pattern is fundamental for any technical analyst looking to anticipate market shifts, particularly in volatile currency and options markets where timing is crucial. While no pattern guarantees future price movements, the Morning Star, when confirmed by other indicators, offers a high-probability setup for potential long entries.
Characteristics of the Morning Star Pattern+
The Morning Star pattern is defined by three distinct candlesticks, each portraying a stage in the market’s sentiment shift:
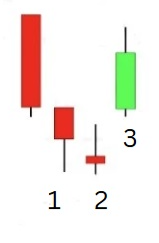
- First Candle (Bearish): This is a long, bearish candlestick, typically appearing at the end of a clear downtrend. It reflects strong selling pressure and a continuation of the bearish sentiment. The larger the candle’s body of this first candle, the more conviction the sellers had, indicating a robust preceding downtrend. The first candle’s body sets the stage for the potential reversal by marking the prevailing bearish dominance. It is essential that this candle closes significantly lower than its opening price, underscoring the bearish momentum.
Second Candle (Doji or Small-Bodied): The middle candlestick is characterized by a small real body, often a doji or a spinning top. This small bodied second candle typically gaps down from the first candle. Its small body indicates indecision in the market; sellers are losing momentum, and buyers are tentatively entering, leading to a near-equal struggle between supply and demand. A doji, where the open and close are virtually the same, signifies maximum indecision and can be a particularly strong sign of a turning point. The gap down from the previous candle’s body suggests that the bearish momentum is attempting to continue but is meeting resistance, failing to create a strong downward move. This candle represents the point of equilibrium or hesitation before the tide turns.
Third Candle (Bullish): The final candle is a strong green candle that opens above the real body of the second candle and closes well into the first candle’s body. This green candle signifies that buyers have taken control, aggressively pushing prices higher. The larger the bullish candle’s body, the more significant the reversal. Ideally, this candle should erase a substantial portion of the losses from the first candle, confirming that the bulls have indeed seized control. The robust close of this green candle, often above the midpoint of the first candle’s body, provides critical confirmation of the bullish reversal.
Is the Morning Star Pattern Bullish?
Yes, unequivocally, the Morning Star pattern is a bullish reversal pattern. It consistently appears at the bottom of a downtrend and signals a potential shift from selling dominance to buying dominance. The sequence of a long bearish candle, followed by a small bodied second candle (the middle candlestick) that gaps down, and finally a strong green candle that pushes back into the first candle’s body, collectively indicates that the bears are exhausted and the bulls are taking control.
Traders interpret this pattern as a strong suggestion that the price is likely to move higher, potentially initiating a new uptrend or a significant upward correction. Its bullish nature is derived from the clear narrative of market sentiment shifting from despair to hope, culminating in renewed buying conviction.
How to Identify the Morning Star Pattern
Accurate identification of the Morning Star pattern involves specific criteria and contextual analysis:
- Confirm a Pre-existing Downtrend: The pattern must emerge within a clear and established downtrend to be a valid reversal signal.
- First Candle: A long bearish candle (red/black) showing strong downward momentum.
- Second Candle: A small-bodied candle (doji or spinning top) that gaps down from the first candle’s close, indicating indecision.
- Third Candle: A long bullish candle (green/white) that opens above the second candle’s body and closes significantly into the first candle’s body (ideally over 50%).
- Confirmation: While not strictly part of the pattern itself, external confirmation such as increased volume on the third candle, formation at key support levels, or oversold readings on oscillators (e.g., RSI) significantly enhances its reliability. Traders should observe the next candle after the pattern forms; a strong bullish next candle , often referred to as confirmation candle, validates the reversal signal and increases confidence in the trend reversal.

Trading with the Morning Star Candlestick Formation
Effectively trading the Morning Star formation requires a disciplined approach, integrating identification with strategic entry, stop-loss, and profit-taking techniques. To trade the morning star, traders should confirm the pattern with technical indicators, wait for a breakout above resistance or support levels, and enter buy positions with careful risk management and timing.

Morning Star Candlestick Accuracy
The Morning Star pattern is considered a moderately reliable bullish reversal signal, especially when appearing at the end of a clear downtrend and supported by other indicators. Its accuracy is enhanced by:
- Strong Preceding Downtrend: A more pronounced downtrend adds credibility to the reversal.
- Clear Gaps: Distinct gaps before the second and potentially third candles strengthen the signal.
- Third Candle Penetration: The deeper the third bullish candle moves into the first bearish candle’s body, the stronger the reversal.
- Volume Confirmation: Increased trading volume on the third bullish candle suggests conviction.
- Confluence with Support: Reliability is significantly boosted when the morning star pattern forms at key support levels such as historical support, moving averages, or Fibonacci retracement lines. When the pattern forms at these critical areas or with oversold oscillator readings, it provides stronger confirmation of potential reversal.
What are the Rules for a Morning Star Pattern?
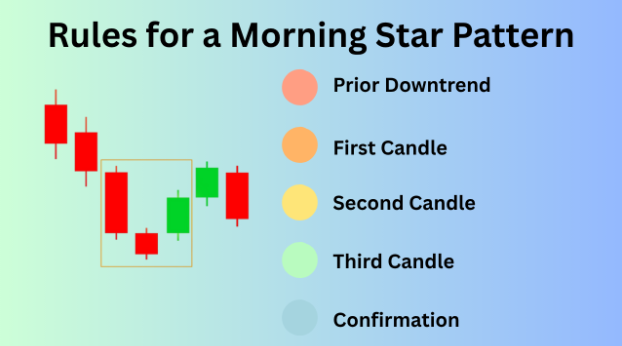
The fundamental rules for a valid Morning Star pattern are:
- Prior Downtrend: A clear downtrend must precede the pattern.
- First Candle: The first candle’s body should be long and bearish, serving as a reference point for the pattern.
- Second Candle: Opens with a gap down and has a small real body (indecision).
- Third Candle: A long bullish candle, opening above the second’s body and closing significantly into the first’s body.
- Confirmation: Subsequent price action and other indicators should confirm the upward move.
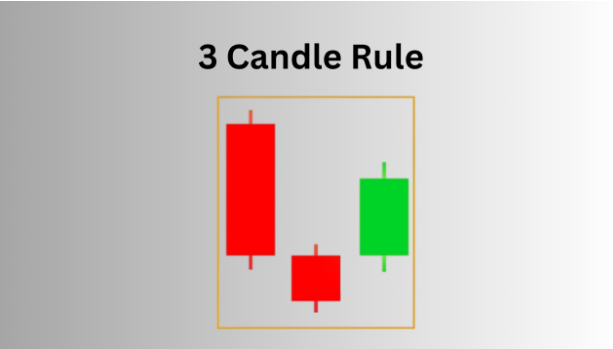
What is the 3 candle rule?
The “3-candle rule” simply refers to the fact that the Morning Star is precisely a three-candlestick pattern.The morning star consists of three specific candlesticks, each playing a distinctive role in the formation: a bearish candle, a small bodied candle (which can be bullish or bearish), and a bullish candle. Each of these three consecutive candles must adhere to its specific characteristics and sequential relationship for the pattern to be correctly identified and considered valid. The rule emphasizes the necessity of all three components to complete the reversal narrative.
How to Trade a Morning Star Pattern?
Trading candlestick patterns like the Morning Star are an essential part of a comprehensive trading strategy. Integrating these patterns with other technical indicators and risk management tools can improve decision-making and increase the likelihood of successful trades.
- Entry Strategy: Traders look for a potential bullish reversal or price reversal when the Morning Star pattern appears. A common entry is to wait for the candle after the third bullish candle to open, confirming the upward momentum. Enter long at the open of this fourth candle, or upon a break above the high of the third Morning Star candle. Aggressive traders might enter near the close of the third candle, but this carries higher risk.
- Stop-Loss Placement: Place a stop-loss order just below the low of the second (star) candle. If price falls below this point, the bullish reversal is likely invalidated.
- Profit Targets: Identify previous resistance levels, Fibonacci retracement levels from the preceding downtrend, or utilize trailing stops to manage profits. Always aim for a favorable risk-to-reward ratio.

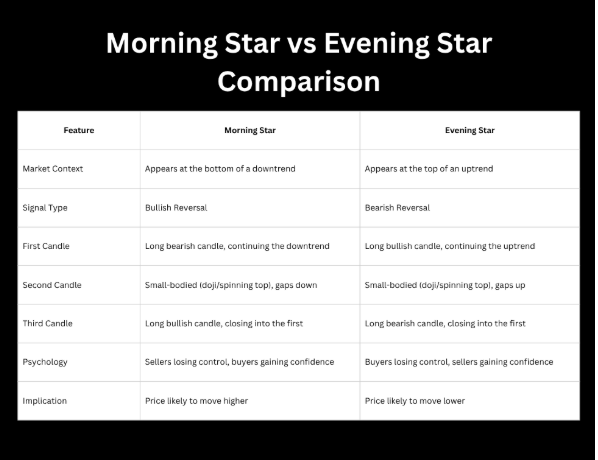
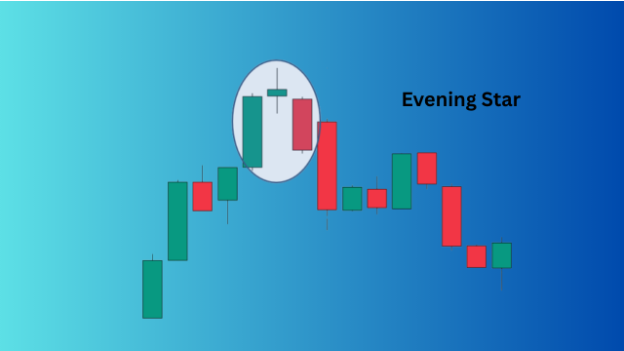
Comparison with the Evening Star Pattern
The Morning Star and Evening Star patterns are inverse signals. The Morning Star is a bullish reversal at the bottom of a downtrend, while the Evening Star is a bearish reversal at the top of an uptrend. Both pattern forms typically develop near key support or resistance levels, such as moving averages or Fibonacci retracement lines, which enhances their reliability. The structure follows the “3-candle rule” and involves a period of indecision (the small middle candle) after a strong directional move.
The third candlestick acts as the key confirmation candle, closing into the body of the first candle and confirming the reversal. The presence of gaps, especially for the second candle, adds to their validity. Trading strategies for both involve confirming the reversal with subsequent price action and other indicators, placing stop-losses beyond the extreme of the pattern, and setting profit targets at logical support/resistance levels..

For a deeper dive into the Evening Star pattern, you can read our dedicated article here.
The Morning Star Pattern: In Summary
The Morning Star is a vital three-candlestick pattern signifying a bullish reversal following a downtrend. When the morning star appears or the morning star forms, it typically consists of a large bearish candle (the first candle’s body), a small-bodied candle (often gapping down) indicating indecision, and a large bullish candle that closes strongly into the first.
Traders look for confirmation when the bullish candle penetrates the first candle’s body, signaling a potential trend reversal. This sequence reflects a market shift from bearish control to bullish dominance. Accurate identification requires confirming the preceding downtrend, observing specific candle characteristics, and ideally using volume or other indicators for confirmation.
When trading, establish entry points based on confirmation, place stop-losses below the pattern’s low, and define profit targets at resistance. While powerful, the Morning Star is most effective when integrated into a comprehensive technical analysis strategy. Its inverse, the Evening Star, provides a symmetrical bearish signal.
Frequently Asked Questions about the Morning Star Pattern
What is the Morning Star pattern in psychology?
It represents a market psychological shift: initial bearish strength (first candle), followed by indecision and waning selling pressure (small second candle), concluding with renewed bullish confidence and control (third strong candle). The size and position of each candle’s body are important, as they reflect the transition from pessimism to optimism within the pattern.

What is the morning star and evening star pattern?
Both are three-candlestick reversal patterns. The Morning Star is a bullish reversal at the bottom of a downtrend. The Evening Star is a bearish reversal at the top of an uptrend. They are mirror images, signaling shifts in market direction.
Is a morning star bullish or bearish?
A Morning Star pattern is bullish. The pattern suggests a potential upward price movement and signals a possible reversal from a downtrend.
What is the difference between a morning star and an evening star?
The Morning Star is a bullish reversal found at the downtrend’s bottom, with a bearish first candle, a small gapping down second candle, and a bullish third candle. The relationship between each candle’s body is key: the third candle’s body often closes above the midpoint of the first candle’s body, confirming the reversal. The Evening Star is a bearish reversal found at the uptrend’s top, with a bullish first candle, a small gapping up, second candle, and a bearish third candle.
What are morning star and evening star candle patterns?
They are multi-candlestick formations used in technical analysis to signal impending trend reversals. These patterns form when the prevailing trend loses momentum, leading to indecision, and then reverses direction. The structure and position of each candle’s body help traders identify when the pattern forms and confirm the signal.
Is the evening star candle bearish or bullish?
The Evening Star candle pattern is bearish. It signals a potential reversal from an uptrend to a downtrend.
Is morning doji star bullish or bearish?
The Morning Doji Star is a variation of the Morning Star where the middle candle is a Doji. A Doji indicates strong indecision, thus a Morning Doji Star is a particularly strong bullish reversal signal.

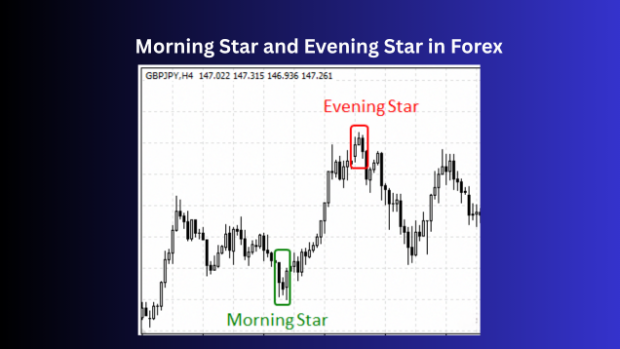
What is Morning Star vs evening star forex?
In Forex, these patterns function the same: the Morning Star signals a bullish reversal in a currency pair after a downtrend (potential buy signal), and the Evening Star signals a bearish reversal after an uptrend (potential sell signal). Their interpretation and trading application are universal across asset classes.
Ready to master the Morning Star pattern and other powerful technical analysis strategies to navigate the markets with confidence? At Maverick Trading & Currencies, we don’t just teach you patterns; we equip you with a proven methodology, comprehensive education, and the opportunity to trade firm capital. If you’re serious about elevating your trading skills and becoming a professional trader, we invite you to take the next step.
Book a call with Maverick Trading & Currencies today to discuss our proprietary trading programs and how you can apply your analytical skills to real-world market opportunities. Our recruiters are ready to answer your questions and guide you through our process.
Book Your Call with Maverick Trading & Currencies