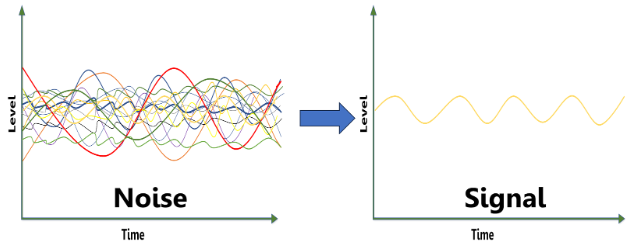
Are you struggling to separate genuine reversal signals from market noise?
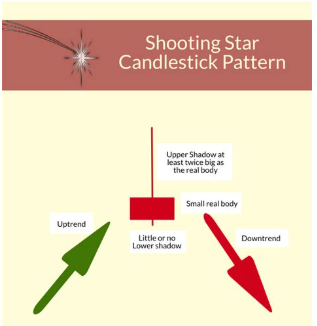
The shooting star candlestick pattern can offer one of the clearest single-bar warnings that an uptrend may be about to reverse—but only if you understand its nuances (see Figure 1). Many traders instinctively sell when they spot a shooting star, only to see the price resume its climb and get shaken out.
In this comprehensive guide, you’ll learn how to distinguish high-probability shooting stars from false alarms, pinpoint the ideal chart context, apply proven confirmation techniques, and manage risk like a pro.
By the end, you’ll have an actionable framework to spot and trade shooting star patterns across stocks, forex, and commodities, with the confidence and discipline that separates Maverick traders from the rest.
Introduction to Candlestick Patterns
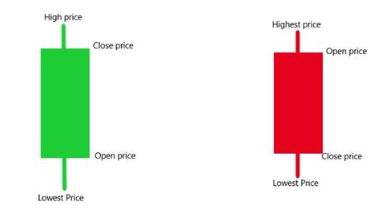
Candlestick charts, first developed in 18th-century Japan, pack four critical data points—open, high, low, and close—into a single visual element. Unlike simple line charts, candlesticks reveal the full spectrum of buyer and seller activity in each session (refer to Figure 1), making it easier to spot turning points and momentum shifts.
Over the past few decades, Western traders have adopted candlestick patterns due to their intuitive appeal and actionable insights. From basic patterns like doji and hammer to complex formations like three black crows, these shapes serve as the foundation for countless trading strategies. The shooting star, one of the most reliable single-bar reversal signals, stands out for its simplicity and effectiveness, provided you know how to read it correctly and position your trades accordingly.
Characteristics of the Shooting Star Candlestick Pattern
At first glance, a shooting star might look like any other candlestick with a long upper wick, but its nuances tell a deeper story (see Figure 2):
- Extensive Upper Shadow: The wick should be at least twice as long as the real body, highlighting a failed rally when buyers push prices higher but lose control before the close.
- Small Real Body: Found near the low of the session, the compact body underscores that sellers regained dominance by the end of trading.
- Minimal Lower Shadow: A tiny or nonexistent lower wick confirms that sellers closed out almost at the session lows, reinforcing bearish sentiment.
These three elements combined reveal a shift in market psychology: early bullish enthusiasm fades into bearish pressure within the same session. Recognizing the precise proportions—not just eyeballing a long wick, will help you avoid misidentifying similar shapes that lack true reversal potential.
Is a Shooting Star Candlestick Bullish or Bearish?
A shooting star is inherently a bearish pattern and a bearish candlestick that signals a potential reversal at the top of an uptrend. This bearish reversal candlestick pattern forms at the peak of an uptrend, warning that the prevailing buying momentum may be exhausted and a potential reversal could occur. The shooting star suggests a shift in market sentiment from bullish to bearish and is classified as a bearish reversal pattern. The pattern occurs during a trading session when price points—open, high, low, and close—form a small bodied candle with a long upper shadow and little to no lower shadow. The shooting star’s high is a key level for stop placement and proper risk management. The shooting star stock pattern and shooting star formation are used in both stock and forex trading, and can be applied to any currency pair.
However, it’s important to remember that this is not a standalone sell signal. In isolation, shooting stars have a modest win rate—often between 50% and 60%—until you layer confirmation filters and risk controls. Key tips for trading patterns like the shooting star include waiting for confirmation, using volume analysis, and practicing proper risk management to improve the pattern’s reliability. Traders often trade the shooting star by entering a short position after confirmation, such as a strong bearish candle closing below the shooting star’s real body. Analyzing closing prices and price movement at critical price points helps validate the signal. Volume analysis and confirmation with a strong bearish candle increase the pattern’s reliability.
Common misconceptions include assuming that any long upper shadow signals an immediate collapse or referring to a bullish shooting star, which is a misnomer—the shooting star is always a bearish pattern. In reality, false signals occur frequently in choppy or low-volume markets. The key is to confirm the transition of control from buyers to sellers through subsequent price action—ideally, a close below the shooting star’s real body within the next two to three bars (see Chart 3 for a star candlestick pattern example and shooting star indicator confirmation scenarios). Compared to other chart patterns and trading patterns, such as the evening star (which features a large bullish candle, a small bodied candle, and a strong bearish candle), the inverted hammer look, and the inverted shooting star, the shooting star stands out as a signal of a potential downward trend after an uptrend.
Introduction to Candlestick Patterns
Candlestick patterns are a cornerstone of technical analysis in financial markets, offering traders a visual roadmap of price action and market psychology. By studying these patterns, traders can spot emerging trends, gauge momentum, and anticipate potential reversals before they fully unfold. Among the most influential candlestick patterns is the shooting star candlestick pattern—a classic signal of a potential bearish reversal. The shooting star pattern stands out for its small body and long upper shadow, which together suggest that bullish momentum has peaked and sellers are stepping in. Mastering candlestick patterns like the shooting star is essential for anyone looking to refine their trading strategies and make more informed decisions in fast-moving financial markets. Whether you’re analyzing a star candlestick or another star pattern, understanding the story behind each candlestick pattern can give you a decisive edge in technical analysis.
Characteristics of a Shooting Star
The shooting star candlestick pattern is easily recognized by its distinctive shape and the message it sends to traders. This star candlestick features a small body—either bullish or bearish—positioned near the session’s low, with a long upper shadow that’s at least twice the length of the body. The long upper shadow signals that buyers pushed prices to new highs during the session, but sellers quickly regained control, driving the closing price back down near the opening price. This sudden shift in sentiment is what makes the shooting star pattern a powerful indicator of a potential trend reversal, especially after an extended uptrend. Both red and green shooting stars can appear, but the red shooting star is generally seen as a stronger bearish signal. Spotting a shooting star after a solid uptrend can alert traders to a possible change in direction, making it a valuable tool in any technical analysis toolkit.
Variations of the Shooting Star Candlestick Pattern
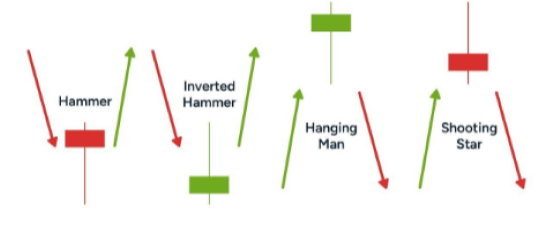
The classic shooting star can morph slightly depending on market conditions and timeframes (illustrated in Figure 3, a candlestick pattern example):
- Doji Shooting Star: When the open and close are virtually identical, forming a Doji body. This variation signals even greater indecision and can precede sharper reversals if confirmed.
Volume analysis can help confirm the patterns reliability for this variation. - Extended Shadow Shooting Star: Some patterns feature an upper wick three or four times the body’s length, indicating an especially aggressive but failed rally that may trigger stronger follow-through selling.
Volume analysis is useful here to validate the pattern’s reliability. - Clustered Shooting Stars: Multiple shooting star candles in a row, while rare, amplify the bearish message by showing repeated failed buyer attempts.
Again, volume analysis can confirm the pattern’s reliability in these cases.
Each variation carries a slightly different risk-reward profile. For instance, a Doji shooting star often demands tighter stops, whereas an extended shadow can justify a larger profit target due to the implied volatility spike. As part of proper risk management, stop-losses are often set just above the shooting star’s high to limit potential losses. This approach helps manage risk if the pattern fails and the price moves higher.
Key tips for trading shooting star variations:
The color of the shooting star candlestick pattern adds another layer of insight into market sentiment. A red shooting star, where the closing price is below the opening price, highlights strong selling pressure and is typically viewed as a more convincing signal of a potential bearish reversal. This suggests that sellers not only rejected higher prices but also managed to close the session lower, reinforcing the bearish outlook. In contrast, a green shooting star indicates that buyers were able to keep the closing price above the opening price, even though they lost control by the end of the session. While both red and green shooting stars can signal a shift toward a bearish reversal, the red shooting star is generally considered a more reliable indicator of mounting selling pressure. For best results, traders should always consider the color of the shooting star alongside other technical indicators and the broader market context before making a move.
Always confirm the shooting star’s signal with volume analysis to improve the pattern’s reliability.
Use proper risk management by placing stop-losses above the shooting star’s high.
Consider the trend context and look for additional confirmation before entering a trade.
Red and Green Shooting Stars
Comparison with Other Candlestick Patterns
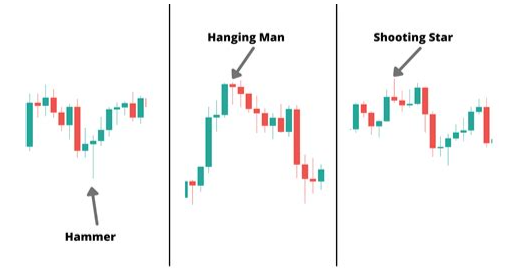
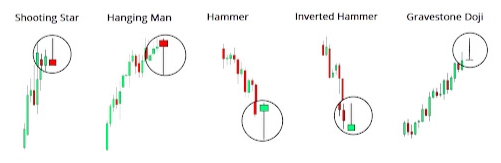
Although the shooting star shares visual similarities with certain reversal patterns, context differentiates their signals (see Figure 4):
| Pattern | Appearance | Trend Context | Signal Implication |
| Shooting Star | Long upper wick, small lower body | After an uptrend | Bearish reversal warning |
| Hanging Man | Long lower wick, small upper body | After an uptrend | Bearish confirmation signal (stronger) |
| Inverted Hammer | Long upper wick, small lower body | After a downtrend | Bullish reversal potential |
| Bearish Engulfing | Large bearish body engulfs prior bar | After an uptrend | Immediate bearish reversal signal |
The evening star is another bearish reversal pattern, consisting of a large bullish candle, followed by a small bodied candle indicating indecision, and then a large bearish candle. The shooting star has an inverted hammer look, but while both patterns appear similar, the inverted hammer candlestick pattern signals a bullish reversal after a downtrend, whereas the shooting star signals a potential reversal to the downside after an uptrend.
Understanding the differences between the shooting star and other trading patterns is crucial for accurate technical analysis.
What is the difference between a shooting star and a hanging man?
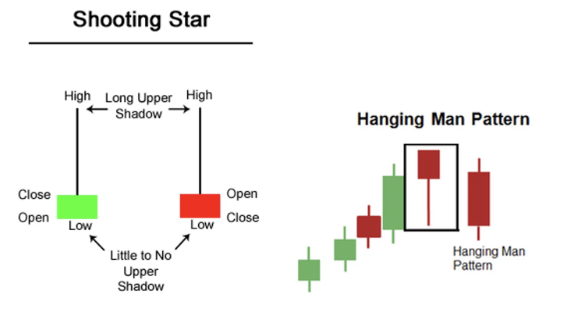
While both patterns appear at potential market tops following an uptrend, the hangingman is charactarized by prominent lower shadow, which distinguishes it from shooting star. The hanging man’s long lower shadow reflects buyer efforts to push prices higher, support that ultimately holds. In contrast, the shooting star’s upper wick shows a rejected rally, signaling selling pressure that overwhelms buyers by the close (refer to Figure 4). Think of the hanging man as a caution flag and the shooting star as a sharper alarm bell.

What Does a Single Candle Symbolize?
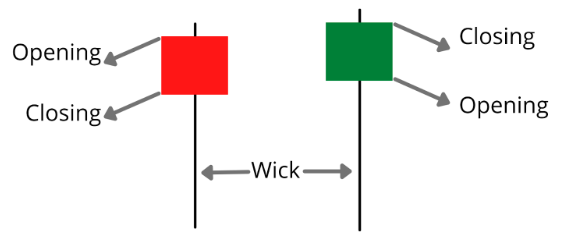
A single candlestick encapsulates the full range of price action within a trading session:
- Open vs Close: The body’s color and size reveal whether buyers or sellers controlled by the trading session.
- High and Low: Wicks show market extremes—points where winning pressure flipped to its opposite during the session.
- Relative Proportions: The ratio of wicks to body indicates conviction and volatility within that trading session.
The shooting star’s anatomy tells a story of an initial bullish surge met by overwhelming bearish counterattack—all within one trading session, represented by a single bar. Mastering this single-bar story is crucial before layering multi-bar confirmation (see Chart 5 in the pattern gallery).
Trading with the Shooting Star Candlestick Pattern
Incorporating shooting star signals into your trading playbook involves more than spotting the shape. To trade the shooting star, traders often enter a short position after confirmation from additional technical analysis. Using the shooting star indicator, it is important to apply proper risk management and volume analysis to confirm the signal and avoid false entries. The shooting star pattern is widely used in forex trading and can be applied to any currency pair. You need a repeatable process that filters out noise and targets the highest-probability setups.
Technical Indicators
Pairing the shooting star candlestick pattern with technical indicators can significantly boost the reliability of your trading signals. Tools like moving averages, the relative strength index (RSI), and Bollinger Bands help confirm the bearish reversal suggested by the shooting star pattern. For example, if a shooting star forms below a key moving average or coincides with an overbought RSI reading, the case for a trend reversal becomes much stronger. Technical indicators can also help pinpoint optimal entry and exit points, allowing traders to fine-tune their trading strategy. Experimenting with different combinations of technical indicators and the shooting star candlestick pattern can help you develop a robust approach that fits your trading style and risk tolerance.
What Does a Shooting Star Indicate in Forex?
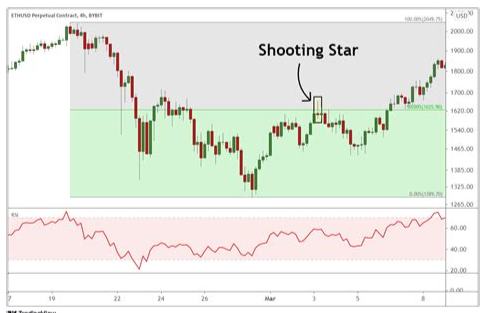
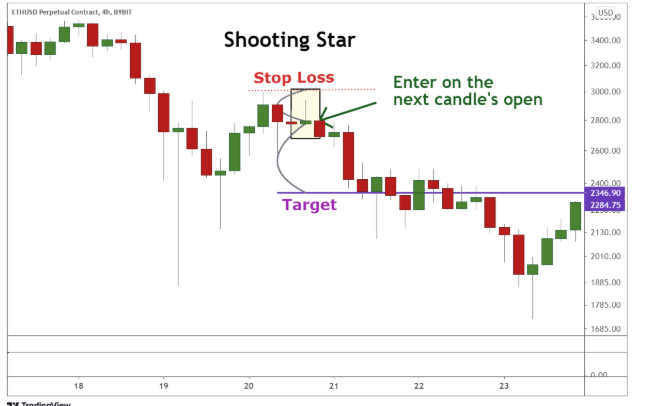
In forex trading, the shooting star candlestick pattern can appear on any currency pair, highlighting points where momentum stalls at key technical levels, such as Fibonacci retracements, pivot points, or round numbers (e.g., 1.2000 in EUR/USD). For example, a shooting star at the 61.8% retracement of a prior swing suggests buyers failed to sustain a rally beyond that threshold. Analyzing price movement after the shooting star helps confirm the signal and determine if a corrective pullback or trend reversal is likely. When you see this shape on a 4-hour or daily chart against increased volume, it often precedes a corrective pullback or trend reversal lasting several bars (refer to Figure 6 for an EUR/USD example).
No pattern is infallible. The pattern’s reliability hinges on several factors (see Chart 7):
- Volume: A shooting star accompanied by above-average volume is more trustworthy, as it confirms seller dominance. Volume analysis is crucial for confirming the validity of the signal and improving trading outcomes.
- Trend Strength: A pronounced uptrend defined by a series of higher highs and higher lows offers a clearer backdrop for a reversal warning.
- Timeframe: Higher-timeframe shooting stars (daily, weekly) carry more weight than intraday bars but require wider stops.
- Proper Risk Management: Implementing proper risk management is essential when trading shooting star patterns to avoid false signals and manage potential losses.
Statistical backtests show that shooting stars with volume confirmation, trend alignment, and proper risk management achieve win rates above 60%, compared to sub-50% when traded in isolation.
What is the 3 Candle Rule?

To filter false signals, many traders use the 3 Candle Rule:
- Identify: Spot the shooting star on your chosen timeframe.
- Observe: Wait for the next two candles to unfold without taking a position.
- Confirm: Enter a short trade only if a strong bearish candle or a bearish candle with closing prices below the shooting star’s real body appears as the second or third candle.
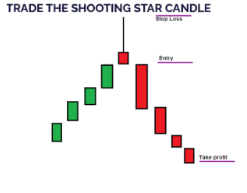
This rule reduces whipsaws by ensuring the initial bearish momentum persists. It also provides a clearer entry point, allowing for more precise stop placement and risk-to-reward calculations (illustrated in Figure 8)..
How to Use a Shooting Star Candle?
Trend Verification: Confirm an established uptrend on higher timeframes (daily/weekly).
- Pattern Spotting: Identify a valid shooting star with a proper wick-to-body ratio.
- Confluence Check: Look for supporting factors such as resistance zones, moving averages, or RSI divergence.
- Entry Trigger: Enter a short position by placing a sell-stop just below the shooting star’s low, triggering only if sellers maintain pressure.
- Stop-Loss Placement: As part of proper risk management et the stop-loss just above the shooting star’s high, accounting for market noise (use ATR for buffer).
- Profit Target: Aim for the next significant support level or a predetermined risk-to-reward ratio (e.g., 1:2 or 1:3), with the exception of a downward trend.
By standardizing each step, you eliminate guesswork and emotional bias, resulting in more consistent outcomes (see the summary flowchart in Figure 9).
Risk Management with the Shooting Star Candle
Even the most reliable patterns require sound risk controls and proper risk management. Here’s how to integrate stops and position sizing:
- Stop Distance: Use the Average True Range (ATR) to calculate a dynamic buffer above the shooting star’s high. Setting your stop-loss just above the shooting stat’s high is a key aspect of proper risk management, helping to prevent early stop-outs in volatile markets (see Figure 10).
- Risk Percentage: Limit risk to 1–2% of your account on any one trade. If your stop is wide, reduce your short position size accordingly to maintain appropriatte risk.
- Trailing Stops: Once the trade moves in your favor, consider trailing your stop below each subsequent lower high or pivot to lock in profits.
Discipline with risk management ensures that even if only 55% of trades win, your winners outweigh the losers, preserving capital for future opportunities.
Common Mistakes
Trading the shooting star candlestick pattern can be highly effective, but only if you avoid some common pitfalls. One frequent mistake is acting on the shooting star without confirmation from other technical indicators or candlestick patterns, which can lead to false signals and unnecessary losses. Another error is ignoring the broader market context—such as the prevailing trend or overall market sentiment—which can undermine the pattern’s reliability. Trading the shooting star during periods of high volatility or in a sideways market can also produce misleading results. Finally, failing to recognize false signals—when the pattern appears but the market doesn’t actually reverse—can catch traders off guard. To improve your trading strategy, always seek confirmation from other technical indicators, pay attention to market sentiment, and be mindful of the context in which the shooting star candlestick pattern appears. This disciplined approach will help you filter out noise and focus on high-probability setups.
What is the Success Rate of the Shooting Star Candlestick?
Academic and industry backtests reveal:
- Baseline Win Rate: 50–60% for raw shooting star signals (see star candlestick pattern example below).
- With Filters: 60–70% when combined with volume analysis for confirmation, trend alignment, and multi-timeframe confluence, which significantly improves the pattern’s reliability.
- Profit Factor: Many traders achieve a profit factor above 1.5, meaning average winners are 1.5 times larger than average losers.
At Maverick Trading & Currencies, our internal records show a star candlestick pattern example with an average win rate of 58% on confirmed shooting star trades, with a profit factor of 1.8—underscoring the pattern’s reliability and edge when volume analysis and other filters are applied (see Figure 11).
Shooting Star Candlestick: Summary
The shooting star candlestick is a potent bearish pattern and a classic bearish reversal candlestick pattern when used correctly. In technical analysis, the shooting star indicator helps identify potential bearish reversals during strong uptrends:
- Anatomy Matters: Look for a long upper wick and small body near session lows, which defines the bearish pattern and signals strong selling pressure.
- Context Is King: Confirm an existing uptrend and key resistance level before acting on the shooting star indicator.
- Confirmation Filters: Apply the 3 Candle Rule and volume checks to validate the bearish reversal candlestick pattern.
- Risk Controls: Use ATR-based stops, position sizing, and trailing stops.
- Performance Metrics: Expect a filtered win rate of 60–70% and profit factors above 1.5.
Key tips: Always confirm the shooting star indicator with trend context and volume, wait for additional bearish confirmation, and manage risk carefully to improve trading accuracy.
Integrate these steps into your trading plan to harness the shooting star’s power with precision and discipline.
Frequently Asked Questions About the Shooting Star Candlestick

1. What is a single candlestick?A single candlestick represents one trading session’s open, high, low, and close. The body indicates net buyer/seller dominance, while wicks reveal intraday extremes and reversals.
2. Can shooting stars be bullish?The term ‘bullish shooting star’ is a misnomer. A shooting star is inherently a bearish reversal pattern that appears after an uptrend, signaling potential downside. If you see a similar candlestick in a downtrend, it is called an inverted hammer (sometimes referred to as an inverted shooting star), which is a bullish reversal signal. There is no valid bullish shooting star pattern.
3. What is the shooting star in a downtrend?A shooting star in a downtrend is less reliable because it contradicts the prevailing bearish momentum. It may signal a short-lived pullback rather than a full reversal.
4. What does a bearish Doji star mean?A bearish Doji star combines the indecision of a Doji with a shooting star’s long wick. It underscores market hesitation and often precedes sharper reversals when confirmed.
5. What is the difference between an inverted hammer and a shooting star?Context differentiates them: an inverted hammer appears at the bottom of a downtrend (bullish), while a shooting star appears at the top of an uptrend (bearish), despite sharing a similar shape. The inverted shooting star is another name for the inverted hammer, and it signals a potential reversal from bearish to bullish after a prior downtrend.
6. What is the evening star pattern?The evening star is a bearish reversal candlestick pattern consisting of three candles: a bullish candle, a small indecision candle, and a bearish candle. It typically appears after an uptrend and signals a potential trend reversal to the downside. The evening star is considered a reliable pattern in technical analysis.
Ready to trade with confidence? Discover how Maverick Trading & Currencies can help you master reversal patterns and elevate your strategy. Book a free call with our expert team now and start capitalizing on high-probability setups today.