You’re staring at the chart. Price just pushed to a new high, the crowd is celebrating, and retail traders are jumping in like it’s a sure thing. But you—you—notice something else. Your RSI is sloping downward. The MACD histogram is weakening. You smirk, recognizing the signs: bearish divergence.
You short the market.
And just like that, price collapses. A cascade of red candles follows, and while others are scrambling, you’re locking in profits, calm and confident. This isn’t luck—it’s technical awareness.
Welcome to the world of bearish divergence. It’s one of my favorite setups as a trader, and it’s a tool that separates rookies from real chart readers. In this post, we’re going to explore everything you need to know about spotting and trading bearish divergence—from regular vs. hidden divergence, to the indicators and risk management rules that make it work.
By the time you finish reading, you’ll know how to catch market tops before the rest of the world even knows what hit them.
Let’s dive in.
Introduction to Divergence
At its core, divergence is a simple—but powerful—concept: it happens when price action and a technical indicator move in opposite directions. And that disconnect? That’s your early warning signal that something is breaking beneath the surface of the market.
Think of it like a poker game. The market’s trying to bluff you with higher highs, but if you know what to look for—weakening momentum, shrinking volume, misaligned indicators—you can see through the act. That’s what divergence gives you: a peek behind the curtain.
There are several types of divergence, but they all revolve around this key idea. When the indicator says one thing, and price says another, it’s time to pay close attention.
Most traders chase price. Divergence traders read it. And in my years of trading, I’ve learned this one truth: the best setups often come when everyone else is caught leaning the wrong way.
In this blog, we’re going to break down divergence into bite-sized pieces, and by the end, you’ll not only understand how it works—you’ll start seeing it everywhere. And trust me, once you see it… you can’t unsee it.
What is Divergence?
Divergence in technical analysis is all about spotting the disconnect between what the price chart is showing and what your favorite technical indicator is telling you. It happens when the price forms a new high or low, but the indicator chart—like RSI, MACD, or Stochastics—moves in the opposite direction. This mismatch is a powerful clue that the current trend may be running out of steam or, in some cases, gearing up for another leg.
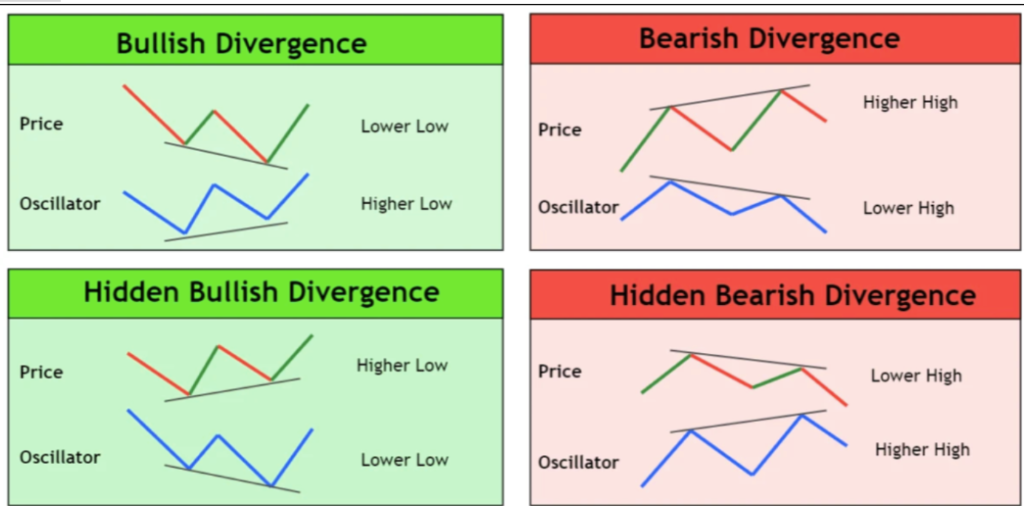
There are two main types of divergence you’ll encounter: bullish divergence and bearish divergence. Bullish divergence occurs when the price forms lower lows, but your indicator forms higher lows. This is a classic sign that downward momentum is fading, and an upward reversal could be on the horizon. On the flip side, bearish divergence occurs when the price forms higher highs, but the indicator prints lower highs—hinting that the bullish run might be losing strength and a trend reversal to the downside could be coming.
But there’s more: hidden divergence. Hidden divergence occurs when the price chart forms a lower high or lower low, while the indicator chart forms a higher high or higher low. This type of divergence is your signal that the current trend is likely to continue, rather than reverse. In other words, while regular divergence warns of a possible trend reversal, hidden divergence tips you off to a potential trend continuation.
Learning to identify divergence—whether bullish, bearish, or hidden—gives you a serious edge in reading market momentum and anticipating the next big move.
Types of Divergences
Divergence comes in two main flavors: regular and hidden. Both are incredibly useful, but they tell you very different things about what the market might do next.
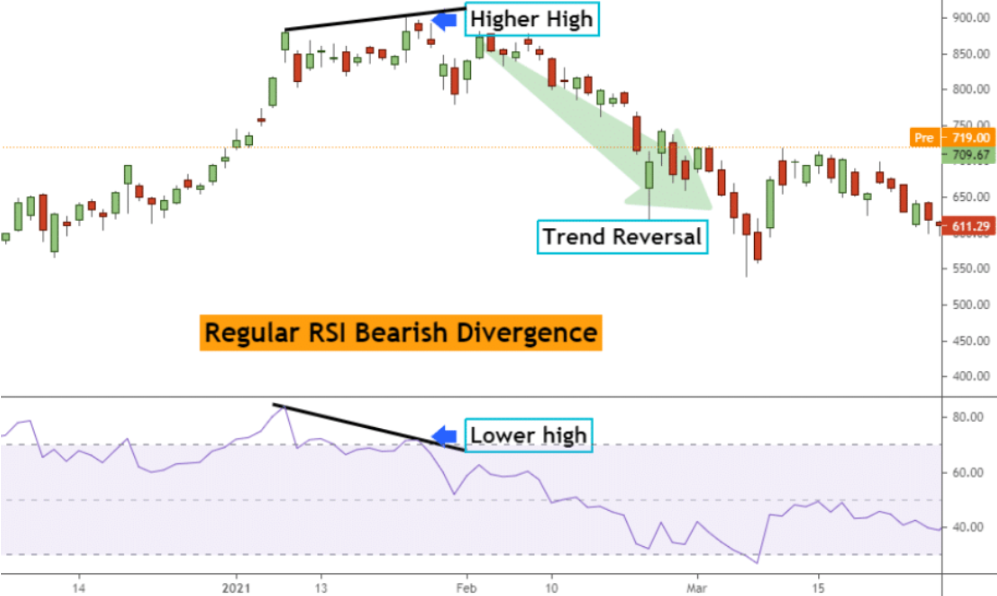
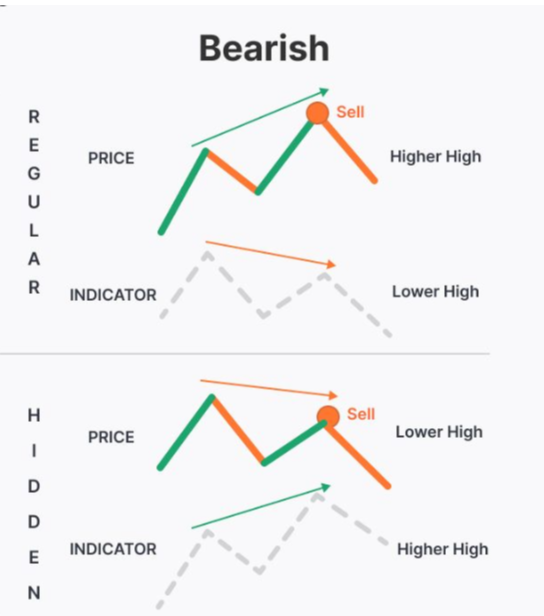
- Regular Divergence is what most traders learn first. It typically signals a potential reversal in the current trend. When you see price making higher highs but your indicator makes lower highs, that’s regular bearish divergence—and it’s a red flag that the bullish run might be nearing its end.
- Hidden Divergence, on the other hand, suggests a potential continuation of the current trend. It’s sneakier, less obvious, and honestly… even more exciting once you learn to spot it. Hidden divergence signals can develop over extended periods and are often stronger predictors of trend continuation than regular divergence, helping traders interpret market momentum and identify potential continuation points. In a downtrend, hidden bearish divergence shows up when price makes a lower high but the indicator makes a higher high. This tells you the pullback is likely just a pause—not a reversal—and the downtrend is ready to resume.
Learning to spot both types gives you the ability to trade reversals and trend continuations like a pro. Technical tools and strategies can help traders identify these divergence patterns, boosting your confidence in recognizing profitable setups. And that, my friend, is how you stay one step ahead.
Regular vs Hidden Divergence
Let’s break it down even further. Traders often mix up regular and hidden divergence because they can look similar at first glance. But knowing the difference? That’s where the edge lives. Accurately identifying divergences is essential to avoid confusion and improve trading outcomes.
Distinguishing genuine divergence from false signals is crucial for making more accurate trading decisions.
Regular Bearish Divergence
- Price action: Makes a higher high
- Indicator: Makes a lower high
- Context: Appears at the end of an uptrend
- Message: Buyers are losing strength—expect a reversal
- Best used for: Catching market tops or fading exhausted rallies
You’ll often find regular bearish divergence near resistance levels or after extended bull runs. It’s your “the party’s over” signal. Look for it in combo with candlestick reversal patterns like shooting stars or bearish engulfing candles. Regular bearish divergence frequently aligns with other bearish patterns, which can reinforce the reversal signal.
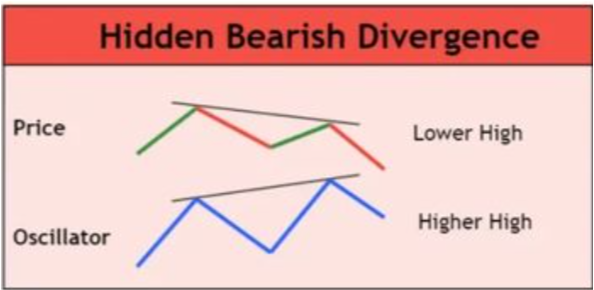
Hidden Bearish Divergence
- Price action: Makes a lower high
- Indicator: Makes a higher high
- Context: Appears during a pullback in a downtrend
- Message: Momentum is still bearish—expect trend continuation
- Best used for: Joining the trend after a bounce
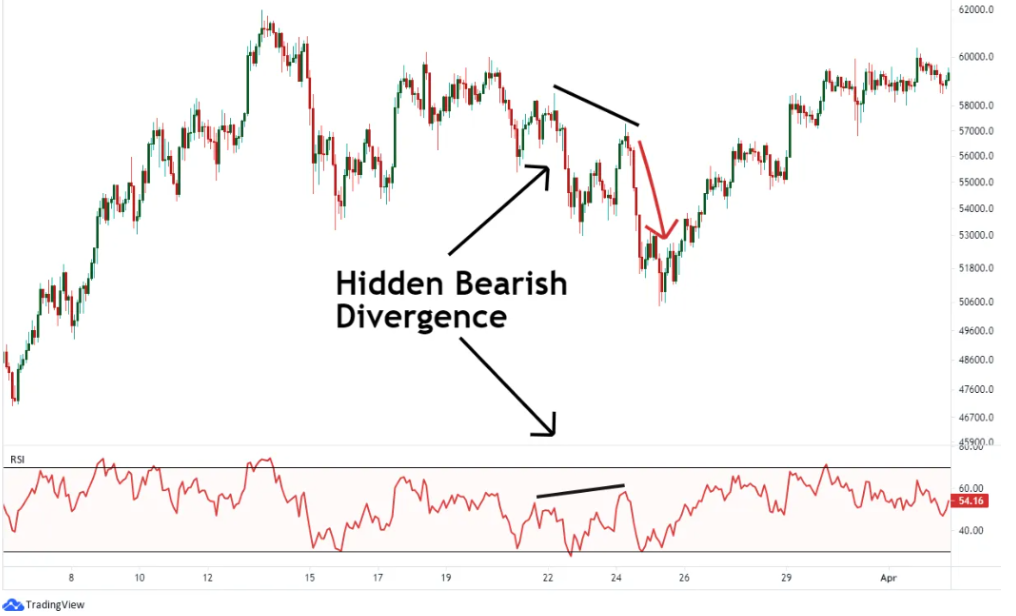
Bearish hidden divergence is the stealthy cousin of regular divergence. You’ll find it after a minor rally within a larger downtrend. Hidden divergence helps confirm the prevailing trend direction by signaling that the downtrend is likely to continue despite a temporary pullback. It’s like the market testing buyers—and failing. When you see hidden bearish divergence, it often means “the drop isn’t done yet.”
Both of these divergences are key tools in your trading arsenal. They don’t just give you setups—they give you insight. And when you pair that with smart risk management and price action, you’re no longer guessing… you’re trading with intent.Just like a bullish engulfing candle can confirm bullish reversals, bearish divergence setups often feature patterns like bearish engulfing or shooting stars to confirm downside momentum.

Bullish vs Bearish Divergence
Before we dive deeper into bearish setups, it’s important to understand both sides of the coin. Bullish and bearish divergence are like mirror images—each with its own role to play.
- Bullish Divergence appears when price makes lower lows, but your indicator (like RSI or MACD) makes higher lows. This tells you that while price is dropping, the selling pressure is weakening.This is also known as positive divergence, which can signal a potential bullish reversal.
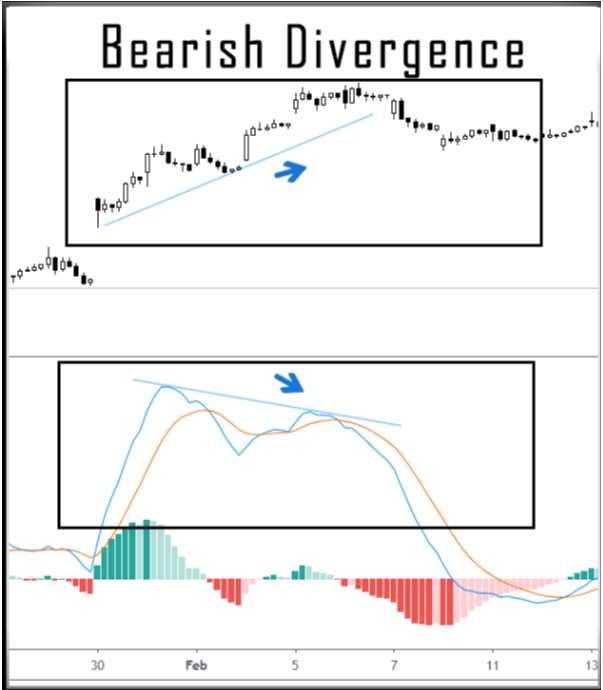
- Bearish Divergence, by contrast, occurs when price makes higher highs, but the indicator prints lower highs. This is a warning that buying momentum is drying up, even as price pushes upward.
Here’s the key: bullish divergence is your tool for spotting bottoms, while bearish divergence helps you catch tops. Both bullish and bearish divergences are key technical signals for identifying market reversals.
In this blog, we’re focusing on bearish divergence, because shorting from the top—when done right—can be one of the fastest ways to stack up profits and outsmart the herd. Understanding both bearish divergences and bullish divergences gives traders an early warning advantage in anticipating market reversals.
Identifying Bearish Divergences
So how do you actually spot a bearish divergence in the wild? Once you know what to look for, it becomes second nature. Technical analysis tools are essential for identifying divergence patterns on price charts, helping traders visually confirm signals and make informed decisions. Here’’s your step-by-step checklist:
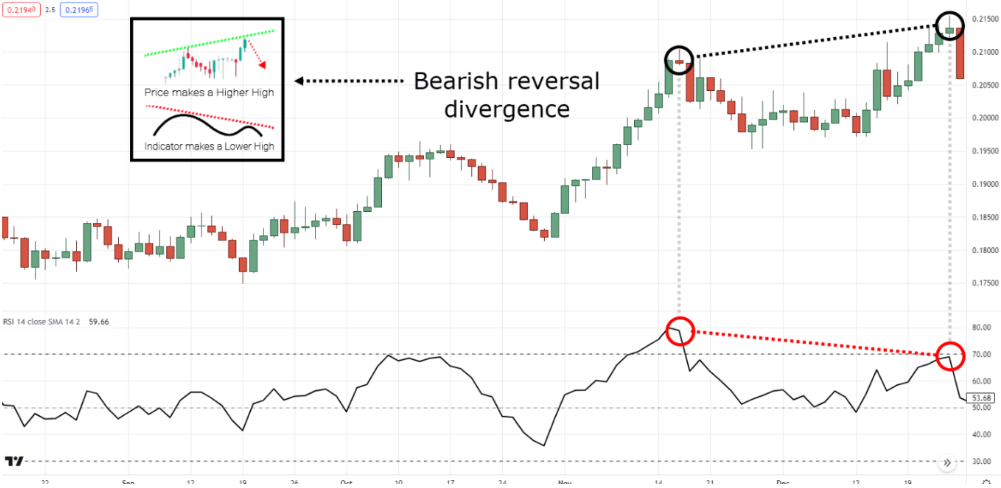
- Price makes a higher high — The market is moving up, printing new peaks.
- Your momentum indicator makes a lower high — RSI, MACD, or Stochastics aren’t confirming the strength of the move.
- Volume often weakens — You may see decreasing volume on the push higher, further confirming lack of strength.
- Bonus points: A bearish candlestick pattern appears at the top — A shooting star, bearish engulfing, or doji can offer a precise entry point.
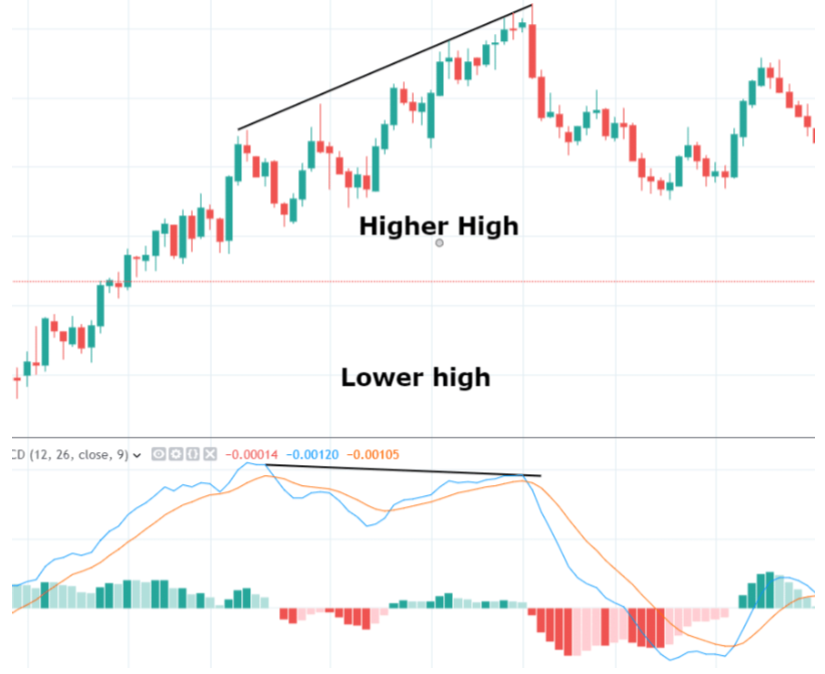
Let’s say the EUR/USD currency pair pushes to a new swing high, but your RSI shows a noticeably lower high than it did on the last peak. This is a common scenario where traders identify divergence signals using price charts and indicators.That’s a red flag. And if it’s near a major resistance level? Even better. Now you’re not just trading divergence—you’re trading confluence.
Pro tip: Use a higher timeframe to confirm the divergence, and then time your entry on a lower one. For example, confirm bearish divergence on the 4-hour chart, then look for a clean entry on the 1-hour or 15-minute.
Bearish divergence gives you a chance to enter a trade before the crowd realizes what’s happening. Instead of chasing the top, you’re calmly setting your trap—ready to ride the wave back down while others are still buying the high.
Hidden Bearish Divergence vs Regular Bearish Divergence
Now that you’ve seen how powerful bearish divergence can be, let’s compare the two main types—regular and hidden—side by side so you know when to use each one.
Regular Bearish Divergence
- Price Action: Higher highs
- Indicator: Lower highs
- Trend Context: End of an uptrend
- Signal: Potential trend reversal
- Use it for: Spotting tops, catching new downtrends early
Regular divergence is a classic “warning shot.” Price is pushing upward, but the indicator is already telling you: This rally is running on fumes. You’ll often find this setup near key resistance levels or after an extended bullish run. The formation of lower highs in price action is a key signal that a bearish trend may be developing.
Hidden Bearish Divergence
- Price Action: Lower highs
- Indicator: Higher highs (hidden bearish divergence is identified at points where price formed a lower high)
- Trend Context: Pullback during a downtrend
- Signal: Trend continuation
- Use it for: Re-entering shorts, riding the existing trend
Hidden divergence is more subtle but just as powerful. It’s your way of saying, the market is just pausing—get ready to ride the next leg down. It’s best used when you already have a downtrend in motion, and you’re waiting for a signal to get back in after a pullback.
Chart Example: Imagine price pulls back to a lower high, right into a downward sloping trendline or moving average, and your indicator (say, MACD) shows a higher high. That’s a textbook hidden bearish divergence—and a green light to short.
By mastering both types, you’ll be equipped to trade both trend reversals and trend continuations—a massive upgrade to your technical toolbox.
Bearish Divergence Trading Strategies
Here’s where it gets fun. Once you know how to spot bearish divergence, it’s time to trade it with confidence. Let’s walk through three proven strategies I’ve used in my own trading, each with clear rules for entry, exit, and risk.
Trading divergences relies on interpreting trading signals generated by divergence trading indicators, which help identify potential market reversals and improve the accuracy of your trades.
Strategy 1: RSI Divergence + Candlestick Confirmation
- Watch for price to make a higher high
- RSI prints a lower high (the RSI indicator is especially useful for identifying overbought and oversold levels, which can signal shifts in market sentiment)
- Look for a reversal candle at the top (shooting star, bearish engulfing)
- Entry: After confirmation candle closes
- Stop-loss: Just above the recent swing high
- Target: Previous support level or key Fib level
This combo is all about momentum + psychology. When buyers lose steam and a reversal candle appears, it’s your cue to enter. Divergence patterns between price and the RSI indicator often reveal important changes in the market sentiment, highlighting potential trend reversals when the market reaches overbought or oversold levels.
Strategy 2: MACD Divergence + Trendline Break
- Price forms higher highs, MACD makes lower highs (the MACD indicator is a powerful tool for detecting divergence and confirming trend reversals)
- Draw a rising trendline under recent lows
- Entry: When price breaks below the trendline
- Stop-loss: Above recent high
- Target: Use risk-reward ratio of 2:1 or better
Strategy 3: Hidden Bearish Divergence + Pullback Entry
- In a downtrend, price forms a lower high
- Indicator forms a higher high
- Entry: As price breaks below recent minor support
- Stop-loss: Above the lower high
- Target: Ride the next wave of the downtrend
This strategy can be applied to various markets, including forex trading with currency pairs. Perfect for traders who missed the first move but want a second chance to enter the trend.
Pro Tip: Combine divergence with strong support/resistance levels, moving averages, or Fibonacci zones to add even more precision to your entries.
Trading bearish divergence isn’t about gambling—it’s about reading the clues, planning your move, and letting the setup come to you. Technical traders use hidden bearish divergence to identify trend continuation opportunities and avoid false buy back signals.
Advantages of Trading the Bearish Divergence

Bearish divergence is one of my go-to setups, and here’s why—it offers traders clarity in moments of market confusion. When everyone else is euphoric at new highs, bearish divergence whispers: Not so fast… Analyzing price movements alongside divergence signals helps traders make more informed decisions by confirming the strength or weakness of a trend.
Here are the key benefits:
Early Warning Signal
Divergence often shows up before price reverses, giving you a head start while others are still chasing momentum.
High-Probability Setups
When paired with support/resistance, candlestick confirmation, or trendlines, bearish divergence becomes a precision entry tool.
Works on Any Timeframe
Whether you’re day trading on the 5-minute or swing trading on the daily, this concept applies across the board.
Simple to Automate
Platforms like TradingView let you build alerts or scripts that notify you when divergence appears—keeping you focused and efficient.
Built-In Risk Control
Because divergence trades often occur at exhaustion points, your stop-loss levels are usually tight—helping keep your risk small and reward large.
With the right tools and discipline, bearish divergence can become one of your most consistent edge setups.
Disadvantages of Trading the Bearish Divergence

Now, let’s keep it real. No strategy is perfect, and bearish divergence has its share of limitations. Knowing these can help you avoid common traps.
False Signals
Divergence doesn’t always mean reversal. Sometimes, price keeps pushing higher despite weakening momentum—especially in strong trends or news-driven markets.
Timing Can Be Tricky
You might spot divergence early, but if you jump in too soon, the trade can go against you before the actual reversal kicks in.
Requires Confirmation
Divergence by itself is not a trade signal. It’s a clue—an invitation to watch more closely. You’ll need candlestick confirmation, trendline breaks, or other tools to validate the setup.
Takes Discipline
Bearish divergence often has you betting against the crowd, which can feel uncomfortable. But comfort rarely leads to profitability in trading.
When used wisely—with a clear plan and tight risk control—these downsides become manageable, and your confidence grows with every successful setup.
Technical Indicators for Bearish Divergence
When it comes to spotting bearish divergence, your best friends are momentum indicators. These tools help you “see beneath the surface” of price action—so you’re not just reacting, you’re predicting.
Here are the top indicators I use and recommend:
Relative Strength Index (RSI)
Simple, powerful, and available on every platform. Look for price to make higher highs while RSI makes lower highs. Sweet spot: 60–70 range for bearish divergence.
MACD (Moving Average Convergence Divergence)
Great for spotting weakening momentum through histogram peaks or signal line crossovers. Ideal for regular divergence setups.
Stochastic Oscillator
Useful for catching divergences during overbought conditions. Watch for lower highs on the oscillator while price prints higher highs.
Awesome Oscillator
This histogram-style indicator works well for visual traders. Divergence is easy to spot through shrinking peaks.
On-Balance Volume (OBV) (advanced)
If volume is your game, OBV offers divergence insights that price alone can’t reveal. When price rises on falling OBV, smart money may be exiting.
Use one indicator for simplicity—or combine two for stronger confirmation. Combining indicators can also help identify bullish divergence setups.
Using Volume to Confirm Divergence
Volume is the secret ingredient that can turn a good divergence signal into a great one. When a divergence occurs, checking the volume helps you gauge the strength and reliability of the signal. For example, if you spot a bullish divergence—where the price forms lower lows but your indicator forms higher lows—an uptick in volume can confirm that buyers are stepping in, making an upward reversal more likely.
On the other hand, if you see a bearish divergence, where the price forms higher highs but the indicator makes lower highs, a drop in volume can confirm that the rally is running out of steam and a downward reversal could be imminent. By combining volume analysis with your divergence analysis, you can filter out false signals and boost your trading accuracy.
Popular technical indicators like the relative strength index (RSI) and moving average convergence divergence (MACD) are often used to identify divergence. But don’t stop there—always check the volume to see if the market is truly backing up the move. This extra step helps you identify divergence with more confidence and avoid getting caught on the wrong side of a trade.
Divergence and Market Conditions
Divergence signals don’t exist in a vacuum—they’re heavily influenced by the overall market environment. In strong trending markets, divergence can be a reliable early warning of a trend reversal. For example, bearish divergences often signal that an uptrend is losing momentum, while bullish divergences can hint that a downtrend is about to turn.
However, in ranging or sideways markets, divergence signals can be less reliable and may produce more false signals. That’s why it’s crucial to always consider the broader market conditions before acting on any divergence signals. Bullish and bearish divergences can show up in both uptrends and downtrends, but their reliability depends on whether the market is trending or just chopping sideways.
Hidden divergence is especially valuable in trending markets, as it often signals a trend continuation rather than a reversal. By understanding the type of divergence and the current market conditions, you can make smarter, more informed trading decisions and avoid getting whipsawed by false signals.
Common Mistakes to Avoid
Trading divergence signals can be a game-changer, but only if you avoid some common pitfalls. One of the biggest mistakes traders make is ignoring the current market conditions. Divergence signals are much less reliable in ranging or highly volatile markets, so always check the trend before you trade.
Another common error is failing to confirm the divergence signal with other technical indicators or volume analysis. Relying on a single indicator can lead to false signals and costly mistakes. Instead, use a combination of tools—like support and resistance levels, candlestick patterns, and volume—to confirm your setup.
Finally, don’t fall into the trap of over-relying on divergence alone. Even the best divergence signals can fail, especially if you’re not paying attention to the bigger picture. By staying disciplined, using multiple forms of analysis, and always being aware of market conditions, you’ll avoid these common mistakes and put yourself in a much stronger position to trade divergences successfully.
Risk Management for the Bearish Divergence
You’ve spotted the divergence. You’re ready to enter. But before you click that sell button—let’s talk risk.
Bearish divergence is powerful, but it isn’t magic. Without proper risk management, even great setups can go wrong fast. Here’s how to protect yourself and trade like a pro:
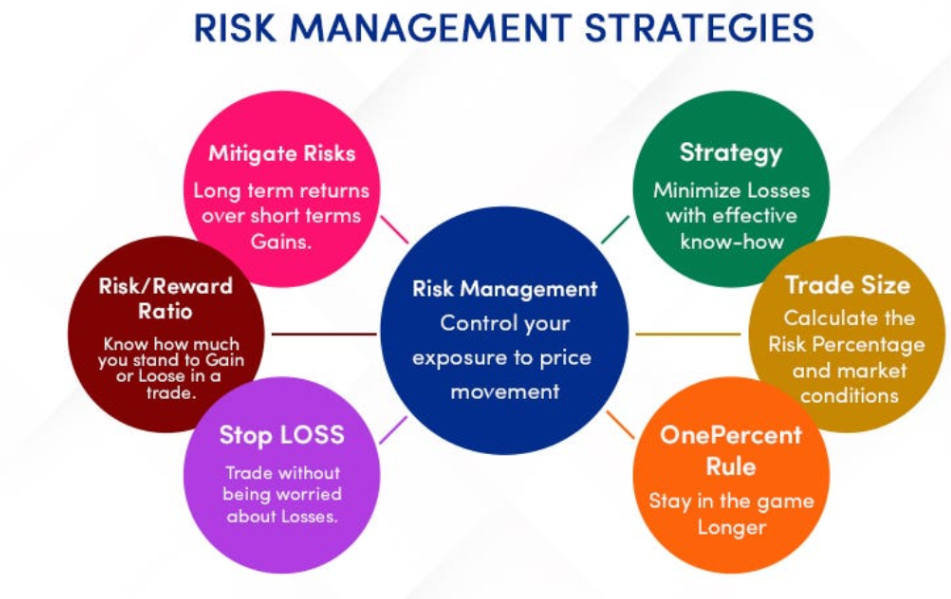
Set a Clear Stop-Loss
Place your stop just above the recent swing high. This invalidates the setup if price keeps pushing up. Don’t widen your stop to “give it room”—respect your edge.
Size Your Position Properly
Never risk more than 1–2% of your total account on any trade. This keeps you in the game, even after a few losing trades.
Use Multiple Confirmations
Don’t rely on divergence alone. Look for support/resistance zones, candlestick patterns, or a trendline break to confirm the trade.
Choose the Right Timeframe
Match your stop-loss and position size to the timeframe you’re trading. A divergence on the daily chart needs a wider stop than one on the 15-minute.
Trail Your Stops
Once in profit, move your stop to break-even, then trail below lower highs. Lock in gains while giving the trade room to breathe.
With these rules in place, bearish divergence becomes a repeatable system, not just a one-off win.
Conclusion
Bearish divergence isn’t just another technical pattern—it’s a market tell. Like a poker player’s nervous twitch, it reveals that the momentum behind the price move is fading. When you learn to read those signals—whether on RSI, MACD, or Stochastics—you stop chasing tops and start anticipating them.
You now know the difference between regular and hidden bearish divergence. You’ve got three solid trading strategies, a toolkit of trusted indicators, and a clear approach to risk management. More importantly, you’ve learned to spot what the majority of traders miss: the cracks in the trend.
Master this setup, and you’ll start entering trades before the reversal is obvious. That’s how pros trade. That’s how you gain an edge.
But don’t go it alone. You don’t need to guess or learn the hard way.
Book a Call with Maverick
At Maverick Currencies, we don’t just teach you technical setups—we train you to think like a professional trader. Bearish divergence is just one piece of the puzzle. Imagine what happens when you combine it with a complete system, mentorship, and real-time coaching.
If you’re ready to level up your trading and turn setups like this into consistent, confident decisions… Book a call with us now
Let’s talk about how we can help you become the trader you’re meant to be