
Order Blocks Demystified: How Smart Money Shapes the Market
Have you ever watched the price on a currency pair rocket upward only to suddenly reverse direction with violent force, seemingly at a random point on the chart? This abrupt shift is often the visible sign of an “Order Block”—the precise footprint of institutional money at work. Retail traders frequently struggle because they chase momentum, entering trades where institutions are preparing to exit, or vice versa. This tension—the misalignment between retail perception and institutional reality—is the single greatest hurdle in profitable trading.
Order Blocks (OBs) are not simply support and resistance lines; they are high-probability zones where the “Smart Money” has executed massive orders, leaving behind an imbalance that the market must eventually return to. Understanding this concept is crucial, as it provides a framework for anticipating institutional moves, offering incredibly precise entry and exit points. By the end of this guide, you will not only master the definition, identification, and advanced strategies surrounding Order Blocks, but you will also learn how to apply key filters to validate your trades, allowing you to stop chasing price and start trading alongside the biggest players in the foreign exchange market.


Introduction to Order Blocks
Order blocks are key price action structures where institutional traders place large buy or sell orders, influencing market direction, making them a crucial concept in understanding market structure and price breaks. An order block refers to a specific price area on a trading chart where large institutional buy or sell orders have been placed, indicating potential support or resistance levels and providing insights into future price movements. These are specific regions on a price chart—represented by a single, powerful candlestick—where a significant volume of institutional orders was last transacted just before a massive, directional move in price (known as “displacement”).
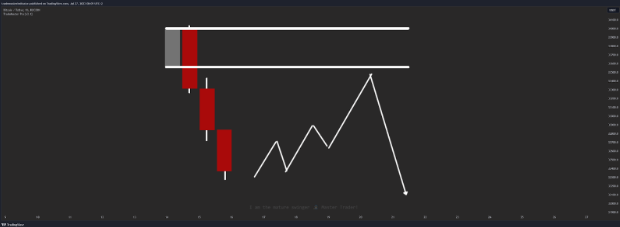
The formation of an Order Block represents a strategic, calculated move by institutional players (such as banks, hedge funds, and large liquidity providers) to inject a substantial amount of capital into the market. These are significant orders placed by institutions. Because these orders are often far too large to be instantly filled at a single price without causing significant slippage, they are executed in a calculated manner. The institutional entity intentionally pushes the price in one direction, often generating a liquidity sweep in the process, only to quickly reverse and push the price with extreme conviction in the opposite direction. The price level of the last opposing candle before this aggressive displacement is what we define as the Order Block, and this represents a key price zone for institutional activity.

Institutional traders use Order Blocks to create and control significant price movements.These actions directly influence overall market movements. This is often done strategically to clear out existing liquidity (by triggering stop-losses of uninformed retail traders) or to distribute or accumulate their full desired position size before initiating the primary trend.
Supply and Demand Analysis
Order Blocks are closely related to traditional supply and demand analysis, but are a far more refined, precise, and actionable concept within institutional order flow. While supply and demand zones are broad ranges, Order Blocks pinpoint the exact price level of institutional imbalance. These Order Blocks can be seen as more specific supply or demand zones, providing traders with a clearer view of where institutional activity is concentrated.

In any market, price moves because of a fundamental imbalance:

Demand exceeds Supply (Bullish): Buyers are aggressive, and price must rise to find willing sellers, leading to an upward trend.
Supply exceeds Demand (Bearish): Sellers are aggressive, and price must fall to find willing buyers, leading to a downward trend.
Order Blocks are the smoking gun of this imbalance creation. When an institutional entity executes a massive order, the sheer volume cannot be instantly matched by the opposing side, leading to the explosive rise or fall in price—the characteristic displacement. These institutional orders are typically placed within specific price zones, which become key areas for identifying potential reversals or consolidations. The market leaves behind a structural void, an “inefficiency,” or a Fair Value Gap (FVG), which acts like a magnetic pull. The Order Block itself is the origin of this move, representing the last equilibrium point before the institutional force took hold.

Understanding the principles of supply and demand is crucial for identifying valid Order Blocks. A high-quality OB is a price level that successfully resulted in a significant shift in market equilibrium, demonstrated by the aggressive displacement that follows its formation. In the case of bullish order blocks, this is often due to significant buying by institutional traders, creating strong support and potential for market reversals. This movement signals likely outstanding, unmitigated orders residing within the Order Block that the institution intends to fill upon the price’s inevitable return—the mitigation move.
The concept of supply and demand remains a foundational aspect of market structure, and integrating how Order Blocks act as precise, institutional-grade zones of imbalance creation is crucial for traders looking to develop a comprehensive, adaptable Smart Money trading strategy

Types of Order Blocks and Their Anatomy
Identifying a truly high-probability Order Block requires a meticulous analysis of the chart to confirm four key elements that signal institutional intent and commitment. When an order block appears on the chart, it is typically the result of significant institutional trading activity, often visible through specific candlestick patterns and price breakout behavior. The presence of these four elements separates a true Order Block from a random candle before a large move.
Four Key Elements of a Valid Order Block
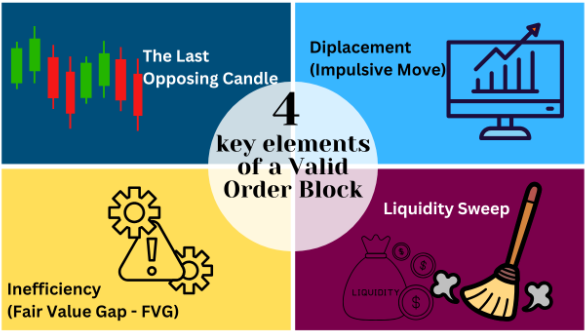
- The Last Opposing Candle: This is the defining feature. The Order Block is represented by the very last candle (typically viewed on H1, H4, or Daily timeframes) that traded in the opposite direction of the new dominant trend before the aggressive move began.
- Bullish OB: The last bearish (red/down) candle before a sharp move up. A bullish block is identified as this last bearish candle, often confirmed by a bullish engulfing pattern, signaling potential upward movement after a bearish trend.
- Bearish OB: The last bullish (green/up) candle before a sharp move down.

2. Displacement (Impulsive Move): This is the confirmation of institutional conviction. Following the formation of the Order Block candle, the price must move away rapidly and aggressively. This displacement is characterized by large-bodied candles that move quickly and definitively, breaking previous highs or lows. This movement must result in a Break of Structure (BOS) or a Change of Character (CHOCH)—a critical signal that the market’s internal bias has shifted.
3. Inefficiency (Fair Value Gap – FVG): The aggressive displacement must leave behind a price inefficiency. This is identified by looking for a three-candle sequence where the wicks/bodies of the first and third candles do not overlap, leaving a clear gap. This FVG often confirms the institutional nature of the move and serves as a crucial magnetic area that pulls the price back toward the Order Block for mitigation.
4. Liquidity Sweep: The most powerful Order Blocks are often preceded by a liquidity sweep. This is where the price momentarily sweeps above or below a previous high or low to intentionally trigger the stop-losses of retail traders resting above or below those structural points. This action provides the necessary counter-party volume (liquidity) for the institutional traders to fully accumulate or distribute their massive positions before commencing the displacement move. This confirms that the institution has “fueled up” for the main trend.

Bullish Order Blocks (Demand Zones)
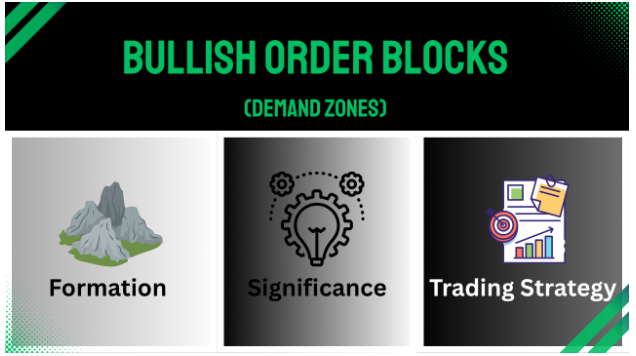
Bullish Order Blocks form when institutional buyers accumulate positions, creating a high-probability demand zone that can lead to a significant price increase.
- Formation: Identify the last bearish (down-closing) candle before a strong, sustained, and impulsive move higher that breaks a prior structural resistance level (BOS). A bullish order block forms when institutional buyers trigger liquidity sweeps or takeouts, pushing the price down to collect liquidity before driving the price upward in a strong reversal.
- Significance: This candle represents the final selling pressure that the institution absorbed to execute its large buy orders before beginning the aggressive upward campaign.
- Trading Strategy: Traders anticipate the price returning to the Order Block’s range (the mitigation phase) to fill the remaining unmitigated buy orders. This retest offers a high-probability long entry. Stop-loss is placed conservatively below the OB’s lowest wick.
Bearish Order Blocks occur when institutional sellers distribute their positions, creating a powerful supply zone that can lead to a significant price decrease.
- Formation: Identify the last bullish (up-closing) candle before a strong, sustained, and impulsive move lower that breaks a prior structural support level (BOS).
- Significance: This candle represents the final buying pressure that the institution sold into (distributed) to execute its large sell orders before initiating the aggressive downward campaign.
- Trading Strategy: Traders anticipate the price returning to the Bearish Order Block to fill the remaining unmitigated sell orders. This retest offers a high-probability short entry. Stop-loss is placed conservatively above the OB’s highest wick.

Identifying Order Blocks
Identifying order blocks is a foundational skill for traders aiming to align their strategies with institutional order flow and gain an edge in the forex market. The process involves analyzing price charts to pinpoint areas where institutional traders have placed significant buy or sell orders, often resulting in a decisive shift in market structure and future price movements.
To effectively identify order blocks, traders should look for specific characteristics on the price chart that signal institutional activity:
- Significant Change in Price Direction: Order blocks often appear at the turning points where the market transitions from a downtrend to an uptrend (bullish order block) or from an uptrend to a downtrend (bearish order block). These reversals are typically marked by a strong, impulsive move that breaks through previous support or resistance levels, indicating a change in market structure.
- Distinct Candlestick Patterns: The presence of bullish or bearish candlestick formations—such as engulfing candles, pin bars, or hammer candles—can help confirm the location of an order block. For a bullish order block, look for the last bearish candle before a sharp upward move; for a bearish order block, identify the last bullish candle before a strong downward move.
- Increased Trading Volume: A spike in volume at the order block zone often signals institutional interest, as large market participants execute significant buy or sell orders. This volume surge helps validate the order block as a zone of genuine supply or demand.
- Break of Market Structure: A valid order block is usually accompanied by a break of a key support or resistance level, confirming that the market has shifted direction due to institutional involvement.

Once you identify an order block, it becomes a powerful tool for planning entry and exit points. For example, a bullish order block can serve as a high-probability demand zone for long trades, while a bearish order block can act as a supply zone for short trades. However, not every order block is equally significant—valid order blocks are those that are supported by clear institutional interest, strong price displacement, and a meaningful change in market structure.
To further refine your analysis, consider combining order blocks with other technical tools such as support and resistance levels, trend lines, and volume indicators. This multi-layered approach helps filter out false signals and provides a more comprehensive view of the broader market context. For instance, a bullish order block that aligns with a major support level and is confirmed by a volume spike offers a higher probability setup than one that stands alone.
In the forex market, identifying order blocks can be especially useful for spotting potential entry and exit points, as these zones often precede significant price movement. By analyzing price charts for order blocks, traders can anticipate where institutional traders are likely to be active, allowing them to position themselves alongside the “Smart Money” rather than against it.
Forex Trading with Order Blocks
Order Blocks are essential for traders to understand because they provide an empirical, objective framework for market analysis, moving far beyond subjective trendlines or generic support/resistance levels. A forex order block is a specific price zone where large institutional traders place significant buy or sell orders, and it is used in trading to identify areas of high probability for market reversals or continuations. Forex order blocks act as key supply and demand zones in the forex market, often aligning with major technical levels and reflecting the activity of central banks and financial institutions. Order blocks in forex signal potential reversals and entry points by highlighting where institutional investors and market makers are active, making them crucial for anticipating market movements. Trading order blocks involves identifying these institutional activity zones and key support or resistance levels, which can help traders anticipate significant price moves. Various trading strategies leverage order blocks to improve trade entries and exits, manage risk, and focus on high-probability setups in liquid markets. They help identify precise areas of the chart that will be respected by the “Smart Money,” allowing for significantly more informed trading decisions and potentially leading to trades with superior reward-to-risk profiles.
Entry Strategy: Trading the Mitigation Move

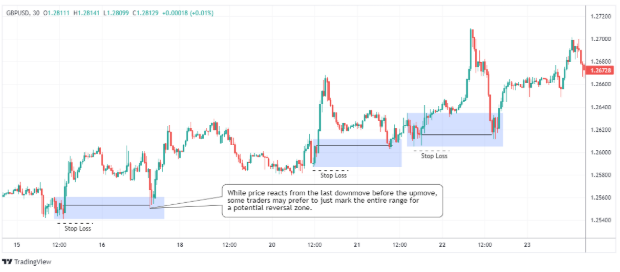
The core strategy for trading an Order Block is waiting for the mitigation move. After the initial displacement, the price will almost always return to the Order Block’s price range eventually. This return is the market’s mechanism for achieving balance and filling the remainder of the large orders that were partially executed during the initial Order Block formation.
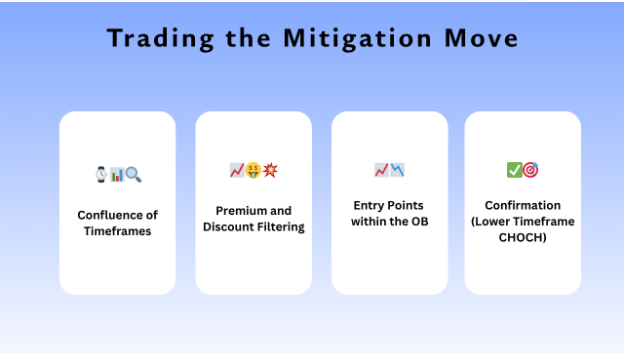
Confluence of Timeframes: A crucial filter is to only trade OBs that are in alignment with the higher timeframe (HTF) market structure (Daily or H4). For example, if the Daily chart is in a confirmed uptrend (making higher highs and higher lows), only look for Bullish OBs on the H1/M15 chart. An H1 Bearish OB should only be traded if it is mitigating a higher-timeframe Bearish OB or is used to target liquidity within a larger retracement.
Premium and Discount Filtering: This is a key institutional concept. When looking at the swing range (from the most recent structural low to the most recent structural high), institutional traders only want to buy in the Discount Zone (the bottom 50% of the range) and only want to sell in the Premium Zone (the top 50% of the range).
Valid Bullish OB: Must reside within the Discount Zone of the current swing.
Valid Bearish OB: Must reside within the Premium Zone of the current swing.
Trading outside these zones significantly reduces the probability of success, as institutions seek optimal price delivery.
Entry Points within the OB: The most precise entries are often found at specific levels within the Order Block’s body:
The Open: The start of the Order Block candle. This is often the first point of contact for a reversal and can serve as one of the potential entry points where traders anticipate market reversals.
The 50% Equilibrium (EQ): The midpoint of the OB candle’s body or wick. This is often referred to as the Point of Control and offers the highest probability for reaction and the best R:R ratio. Identifying these zones provides potential trade entries, allowing traders to execute actionable setups based on strong buying or selling areas.
Confirmation (Lower Timeframe CHOCH): For extra safety, drop to a lower timeframe (M5 or M1) as the price enters the OB zone. Wait for the price to break the immediate opposing swing structure on that lower timeframe (a micro-CHOCH) before taking the trade. This confirms that the institutional reaction is underway before commitment.
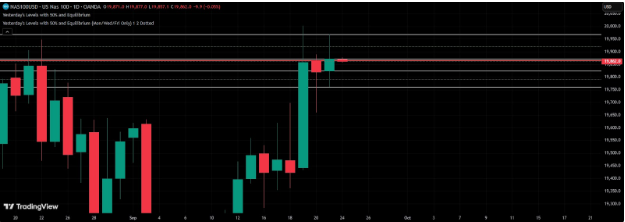
When setting take-profit targets or scaling out of a position after entering a trade based on an order block, traders often look to the next significant resistance level as a logical area to secure profits. Recognizing the significant resistance level is crucial for effective trade management, as these points often indicate where the market may encounter selling pressure or potential reversals.
Incorporating Order Blocks into a trading strategy helps traders anticipate potential price movements, including breakouts and reversals, and make more informed decisions about entry and exit points that are aligned with the professional, institutional flow.
Risk Management and Trade Execution Mastery
Order Blocks are incredibly powerful because they facilitate extremely tight stop-loss placement, which directly translates into high reward-to-risk ratios (often exceeding 1:4 or 1:5). Proper execution is paramount:
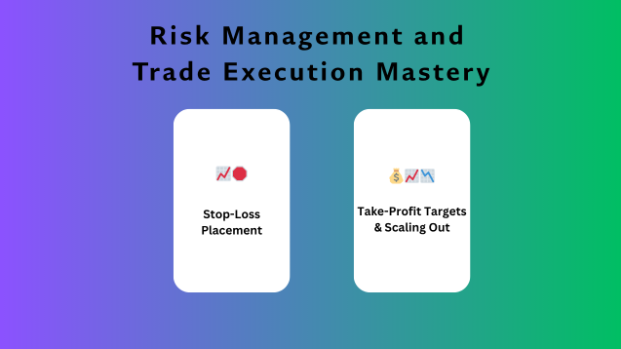
- Stop-Loss Placement:
- Bullish OB: Place the stop-loss conservatively, usually 5-10 pips below the absolute low of the Order Block candle’s wick.
- Bearish OB: Place the stop-loss conservatively, usually 5-10 pips above the absolute high of the Order Block candle’s wick.
- This tight placement reflects the institutional premise: if the OB zone is violated, the original institutional trade idea is completely invalid, and you must exit the trade immediately.
- Take-Profit Targets & Scaling Out: Targets should be set at the next key structural points. These include previous highs/lows, opposing Order Blocks, or, most importantly, large liquidity pools (equal highs/equal lows) where retail stop-losses and pending orders are accumulated. A professional strategy involves scaling out—taking partial profits (e.g., 50% of the position) at a 1:2 or 1:3 R:R level, moving the stop-loss to break-even on the remaining position, and letting the final portion run to a higher-timeframe structural target. This locks in profit while maintaining exposure to the big move. We delve into identifying these stop pools in our deep dive on Liquidity Sweeps (https://maverickcurrencies.com/liquidity-sweep/).
The meticulous analysis required for Order Blocks, combined with rigorous risk management, is a crucial component of a comprehensive, high-probability trading methodology known as Smart Money Concepts (SMC).

Advanced Order Block Trading Topics
For the serious trader committed to mastering institutional mechanics, the Order Block concept extends into several advanced structures that signal precise shifts in market control. The ict order block, a specialized concept popularized by the Inner Circle Trader, focuses on identifying order blocks with an emphasis on order flow and institutional trading patterns. These concepts provide a more nuanced understanding of market structure and institutional activity. Understanding order blocks also enhances comprehension of other trading concepts such as price action and market structure. Additionally, order block trading strategies help traders identify key institutional price levels, supporting smart money activity and improving trade accuracy.
The Fair Value Gap (FVG) Deep Dive
The FVG is not just a gap; it is the absolute confirmation of the Order Block’s power. It represents the zone of price where one side of the market (buy or sell) was dominant, and trades were only executing in one direction.
- Purpose: The FVG acts as the initial magnetic force pulling price back toward the Order Block. Its presence confirms the institutional velocity and is a high-probability target for the market to revisit.
- FVG Mitigation Nuances:
- Partial Fill: Often, the price will only fill the FVG partially (e.g., to the 50% level) before reversing. This indicates extreme institutional urgency.
- Full Fill: Price completely fills the FVG but respects the Order Block. This is a common and reliable setup.
- Flipping the FVG: If the price blows right through the Order Block and the FVG, the FVG often “flips,” and the next time price returns to the FVG level from the other side, the FVG acts as resistance/support to confirm the new trend.
Breaker Blocks: The Failed Order Block
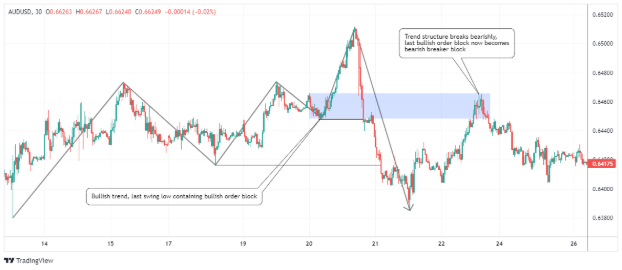
A Breaker Block is one of the most powerful structures in the SMC repertoire because it signals a major shift in institutional bias, often confirming a long-term reversal. It is an Order Block that failed its primary function.
- Initial Failure: Price executes an Order Block setup (e.g., a Bullish OB) but, instead of finding support and reversing, it breaks cleanly through the OB and aggressively continues, resulting in a new, strong Break of Structure (BOS) in the opposite direction.
- Role Reversal: The last opposing candle of the failed swing is the Breaker Block. If the failed swing was trying to go up, the last up candle becomes the Bearish Breaker. The previous low/high before the OB failure is also contained within the Breaker.
- The Retest: When the price returns to the Breaker Block zone, this zone acts as the opposite of its initial intent. The money that initially failed to push the price has now been mitigated, and the area serves as a strong entry point for the new, dominant trend. This area now holds the highest probability for a reversal entry. A rejection block forms when the market fails to break through an order block, resulting in a sharp reversal at that price zone. Rejection blocks often signal strong underlying buying or selling pressure and highlight potential reversal points, making them valuable for identifying potential trade entries.

Institutional Order Flow (IOF)
The Order Block is the micro-level manifestation of the macro-level concept of Institutional Order Flow (IOF). IOF refers to the consistent directional bias maintained by institutional entities.
- Consistent Displacement: When a market exhibits strong IOF, you will see a consistent pattern: price creates an Order Block, displaces aggressively, returns to mitigate the OB/FVG, and then displaces again. This stair-stepping pattern confirms that the institutional direction is firmly established.
- Trading with IOF: Only take trades that are aligned with the highest timeframe IOF. If the Weekly chart is overwhelmingly bullish, your H1 Bearish OB trades are low-probability scalps, while your H1 Bullish OB trades are high-probability entries aligned with the dominant institutional trend.
Mitigation Blocks
A Mitigation Block is a specific term referring to the last up or down candle before a structural swing that failed to break a prior high or low, similar in setup to a Breaker Block. The market returns to this candle to “mitigate,” or neutralize, the loss-making orders from that failed swing, allowing the area to function as a strong zone of support or resistance for the continuation of the true trend. These mitigation blocks can also act as resistance zones when price revisits them from below, or provide strong support when approached from above. In some cases, rapid price movement through these areas can create a vacuum block, characterized by low liquidity and minimal trading activity, which may lead to increased volatility and trading opportunities. However, order block signals may be less reliable in a consolidating market, where price action is sideways and lacks clear direction. Recognizing ranging markets is crucial, as order block strategies are generally more effective in trending conditions than in markets moving within a defined range. Mastering this and other related concepts—including supply and demand zones, liquidity voids, and market volatility—is essential for developing a deep understanding of institutional trading activity and market structure, a methodology popularized by the Inner Circle Trader (ICT). The strategic combination of these tools—Market Structure, Order Blocks, Liquidity, and Fair Value Gaps—provides a unified, high-probability approach, further detailed in our guide on What is ICT in Trading? (https://maverickcurrencies.com/what-is-ict-in-trading/).
Conclusion
The pursuit of consistency is the pursuit of institutional flow. The Order Block methodology provides the ultimate roadmap, precisely identifying where banks plant their footprint. We established that OBs are specific last-opposing candles preceding aggressive displacement and a definitive break in market structure. The guide analyzed Bullish and Bearish types, emphasized the importance of FVG, explored Breaker Blocks, and detailed the necessity of filtering trades using the Premium and Discount zones. Mastery allows you to shift from chasing noise to anticipating high-probability reversals. By combining valid OB identification with critical structural filters, stringent risk management, and patience, you position yourself to trade with the precision and discipline of the Smart Money. The journey to profitability is often difficult, but armed with the institutional insight provided by Order Blocks, you have acquired a powerful framework to navigate the forex market with confidence.
Are you ready to stop trading against the institutions and start trading alongside them?
Developing the discipline and technical eye to execute Order Block strategies flawlessly takes practice and mentorship. Book a free consultation call with Maverick Trading & Currencies today. Let us help you integrate this high-probability methodology into a robust, disciplined trading plan that puts you on the path to consistent profitability.