Inverted Hammer Candlestick: How to Trade Bullish Reversals

The Inverted Hammer is one of the most potent candlestick patterns in technical analysis, widely recognized for its ability to signal a potential reversal in the market. Traders who understand how to interpret this pattern, particularly the inverted hammer candle, can gain a significant edge in identifying turning points, especially after a prolonged downtrend.
But what exactly makes the Inverted Hammer so powerful? It’s all about market psychology. When this pattern forms, it reveals a shift in sentiment, where selling pressure begins to wane and buyers step in, pushing the price back up. However, the key to successfully trading with the Inverted Hammer lies in knowing when to trust it and how to act on it.
In this article, you will learn how to recognize an Inverted Hammer, how to incorporate it into your trading strategy, and how to confirm its validity. We’ll delve into the ideal market conditions for this pattern, explaining why it works best at the end of a downtrend. Furthermore, we’ll explore how to use the Inverted Hammer in conjunction with other technical indicators, such as support and resistance levels, RSI, and moving averages, to improve the accuracy of your trades.
Whether you’re an experienced trader looking to refine your strategy or a beginner just starting to explore candlestick patterns, this guide will provide you with the knowledge to capitalize on the Inverted Hammer’s potential. By the end of this article, you’ll have a solid understanding of how to trade with this powerful reversal signal, set effective stop-loss levels, and develop a comprehensive risk management plan to enhance your trading success.

For those interested in expanding their knowledge of candlestick strategies, we encourage you to explore our internal resources on 5 Common Reversal Candles and Japanese Candlestick Charting.
Introduction to Candlestick Patterns
Candlestick patterns are a crucial component of technical analysis in trading, providing valuable insights into market trends and potential reversals. These patterns are formed by the combination of opening and closing prices, as well as the high and low prices, of a security over a specific period. One of the most significant candlestick patterns is the hammer candlestick pattern, which is a bullish reversal pattern that signals a potential trend reversal.
The inverted hammer candlestick pattern is another important pattern that is similar to the hammer but has a different implication. Understanding these patterns is essential for traders to make informed decisions and maximize their profits.
What Is an Inverted Hammer Candlestick?
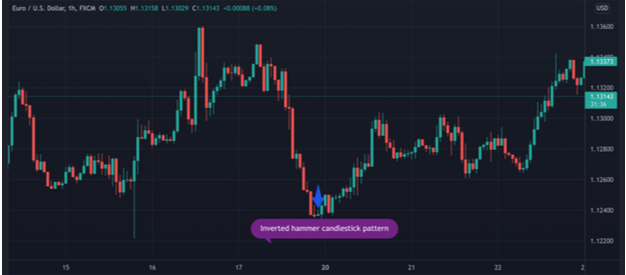
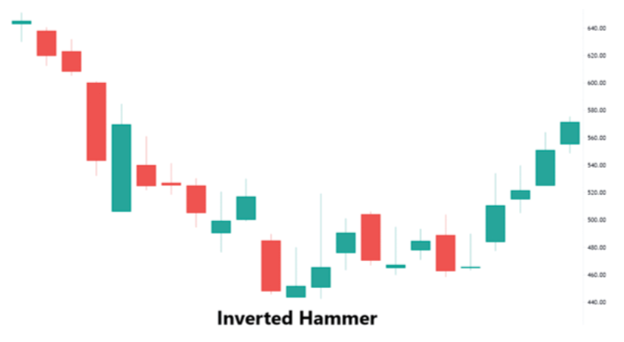
The inverted hammer formation is a distinctive single candlestick pattern that plays a pivotal role in technical analysis, especially when identifying potential trend reversals. This pattern is typically observed at the end of a downtrend, signaling that the market sentiment may be shifting, and a bullish reversal could be on the horizon. The inverted hammer has a unique structure, making it easily identifiable, and understanding its components can provide traders with valuable insights.
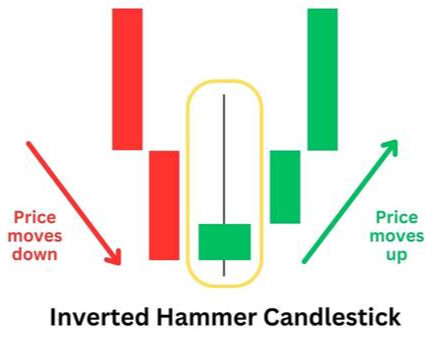
The pattern consists of a small real body located near the low of the candlestick, which is the starting point for analysis. The long upper shadow—sometimes referred to as the wick or tail—typically extends at least twice the length of the real body, showing that during the session, the price moved higher before closing near the opening price. The little or no lower shadow is another key characteristic, meaning the price action did not drop much lower than the opening price, reinforcing the idea that the bears (sellers) lost control as the session progressed.
The psychology behind the inverted hammer is crucial for understanding its significance. Sellers initially controlled the market for most of the session, pushing the price lower. However, as the session unfolded, buyers began to step in aggressively, driving prices back up and closing near the opening price. This shift in momentum indicates that the market is losing its bearish strength, and the buyers are starting to gain control, potentially setting the stage for a reversal.
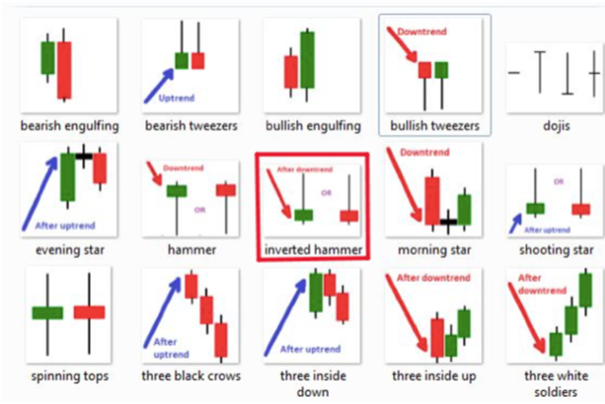
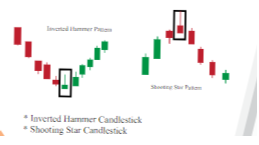
To be considered valid, the inverted hammer pattern must occur after a downtrend. This is because the pattern reflects a shift from bearish to bullish sentiment, making its appearance in an uptrend less reliable. If the same structure appears after an uptrend, the pattern is known as a shooting star. Unlike the inverted hammer, which signals a bullish reversal, the shooting star is a bearish reversal signal, as it suggests that buyers were initially in control but that the bears gained strength and pushed the price back down by the end of the session.
The key takeaway here is that the inverted hammer, when found after a downtrend, is a potential early warning of a trend reversal. However, its predictive power increases when combined with other technical analysis tools, such as support levels, volume confirmation, and other candlestick patterns.
How to Identify the Inverted Hammer
To accurately identify the inverted hammer candlestick pattern, traders must ensure it meets several specific criteria. These criteria help to distinguish this pattern from others and increase its reliability as a potential reversal signal.
- Appears After a Clear Downtrend
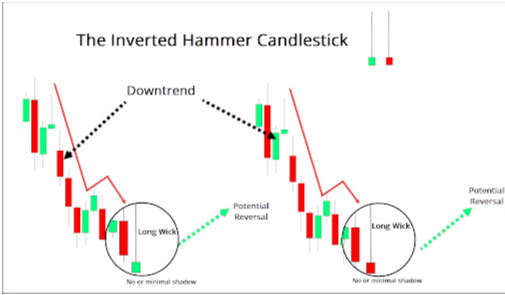
The inverted hammer must be seen at the end of a downtrend. The pattern is most effective when it shows up after a significant price decline, signaling a potential shift in market sentiment. Without the preceding downtrend, the inverted hammer loses its significance and becomes just a regular candlestick. - Has a Small Real Body Near the Low of the Session
The real body of the candlestick should be relatively small and located near the low of the session, indicating that the price did not move much in one direction. A small real body suggests indecision in the market, with both the bulls and bears fighting for control. This placement signals that the bears dominated for most of the session but that the bulls managed to push the price back up toward the session’s close. - Features an Upper Shadow at Least Twice the Length of the Real Body
A key feature of the inverted hammer is the long upper shadow, which should be at least twice the length of the real body. The upper shadow demonstrates that buyers tried to push the price higher during the session, but the bears managed to push it back down. The longer the upper shadow, the more significant this reversal attempt becomes. The upper shadow represents the potential for bullish momentum, as it shows that the market is reacting to higher buying pressure. - Has a Minimal or Nonexistent Lower Shadow
One of the defining traits of an inverted hammer is its minimal or nonexistent lower shadow. A lack of a lower shadow means that the price didn’t drop significantly below the opening price during the session. The absence of a lower shadow indicates that the sellers were unable to keep the price down, further reinforcing the idea that the bulls were gaining strength toward the close of the session. - Confirmation is Key
While the inverted hammer itself can be a powerful signal, confirmation is essential for increasing the pattern’s reliability. A bullish confirmation occurs when the next candlestick closes higher than the close of the inverted hammer. This confirms that the bulls have successfully taken control, and the reversal may be starting. Without this confirmation, the inverted hammer may simply be a false signal, and traders could risk entering a trade prematurely.
Recognizing the inverted hammer on a price chart can help traders anticipate trend changes and incorporate these insights into their trading strategies.
What the Inverted Hammer Tells Us
The pattern signals hesitation in the current downtrend. Sellers dominate early, but buyers drive prices up before the close. Even though the price may settle near its open, the battle between bulls and bears creates a psychological setup for reversal. Confirmation through a bullish candle validates this shift in momentum, indicating a potential bullish reversal.
Comparison With Other Candlestick Patterns
Compared to stronger multi-candle setups like the morning star or bullish engulfing pattern, the inverted hammer is subtler. It relies more heavily on context and confirmation. Read our article on 5 Common Reversal Candles to compare how these patterns function in trend changes.
For a broader foundation, our Japanese Candlestick Charting Guide explains candlestick construction, pattern psychology, and integration into technical trading systems.

Bearish vs Bullish Inverted Hammer
The inverted hammer candlestick pattern is a type of candlestick pattern that can be either bearish or bullish, depending on the context in which it appears. A bearish inverted hammer is formed when the pattern appears at the top of an uptrend, and it signals a potential trend reversal. On the other hand, a bullish inverted hammer is formed when the pattern appears at the bottom of a downtrend, and it signals a potential trend reversal.
The key difference between the two is the location of the pattern in relation to the prevailing trend. Traders should be cautious when interpreting the inverted hammer pattern, as it can be a false signal if not properly confirmed. The use of additional technical analysis tools, such as trendlines or moving averages, can help traders to increase the accuracy of their predictions.
Real-World Example of the inverted hammer candlestick
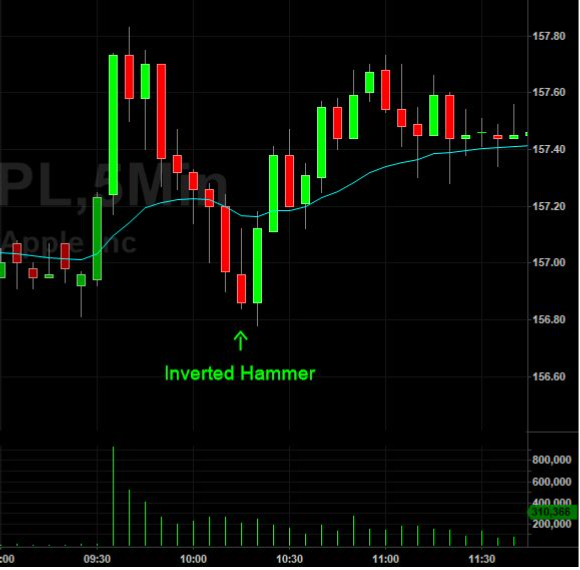
Imagine a stock like Tesla (TSLA) in a two-week downtrend. Intraday charts are particularly relevant for identifying patterns like the Inverted Hammer Candlestick Pattern due to their higher frequency of occurrence in shorter time frames. On day 11, an inverted hammer appears at a support level with an intraday high significantly above the open. The next day opens higher and closes strong, completing a confirmation. The confluence of price action, pattern, and support gives confidence in a bullish reversal.
How to Trade the Inverted Hammer
- Wait for Confirmation: Enter only after a bullish candle confirms the reversal as part of your trading strategies.
- Use Technical Confluence: Look for overlapping support levels, volume spikes, or positive RSI divergence.
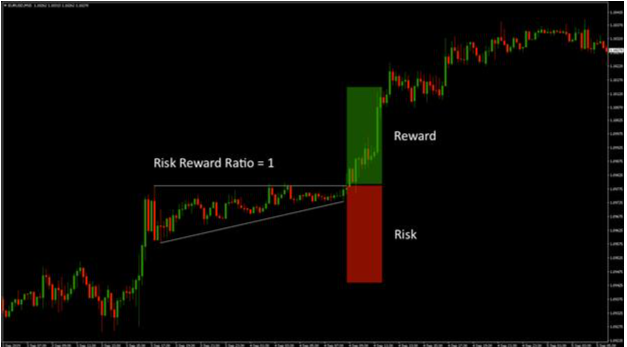
3. Define Risk: Set stop-losses below the inverted hammer’s low.
4. Define Reward: Use nearby resistance or ATR-based targets for exits.
Advantages and Limitations of the Inverted Hammer
The inverted hammer candlestick pattern has several advantages that make it a valuable tool for traders. One of the main advantages is its ability to signal a potential trend reversal, which can be a lucrative opportunity for traders. The pattern is also relatively easy to recognize, making it accessible to traders of all levels.
However, the inverted hammer pattern also has some limitations that traders should be aware of. One of the main limitations is the risk of false signals, which can occur if the pattern is not properly confirmed. Additionally, the pattern can be influenced by market volatility, which can increase the risk of false signals. Traders should use the inverted hammer pattern in conjunction with other technical analysis tools to increase its reliability and accuracy. By understanding the advantages and limitations of the inverted hammer pattern, traders can use it to their advantage and make more informed trading decisions.
Frequently Asked Questions
Is the inverted hammer always bullish?
It’s a bullish reversal signal only when it appears in a downtrend. A green inverted hammer, where the closing price is higher than the opening price, signifies stronger buying pressure and indicates a potential market trend reversal.
Can an inverted hammer appear on any timeframe?
Yes, but it’s more reliable on higher timeframes (daily or weekly), as these provide more reliable patterns for traders to base their strategies on.
How do I tell an inverted hammer apart from a shooting star?
The only difference in trend context matters: inverted hammers follow downtrends, shooting stars follow uptrends.
Does volume matter?
Yes, rising volume during the pattern and confirmation candle adds credibility, and a higher closing price can further signal bullish trends.
Can the inverted hammer candlestick pattern fail?
Yes, especially without confirmation or supporting signals. It’s a probability tool—not a certainty. Therefore, using risk management tools is essential to mitigate potential failures.
Final Thoughts on the Inverted Hammer Candlestick
The inverted hammer candlestick pattern is a useful but often misunderstood signal of a potential trend change. When placed in the right market context and confirmed with price action, it can offer an early warning of a trend reversal. Paired with smart risk management, it’s a tool every trader should understand.